
Can Stellar Price Reach $2 in the Next 15 Days?
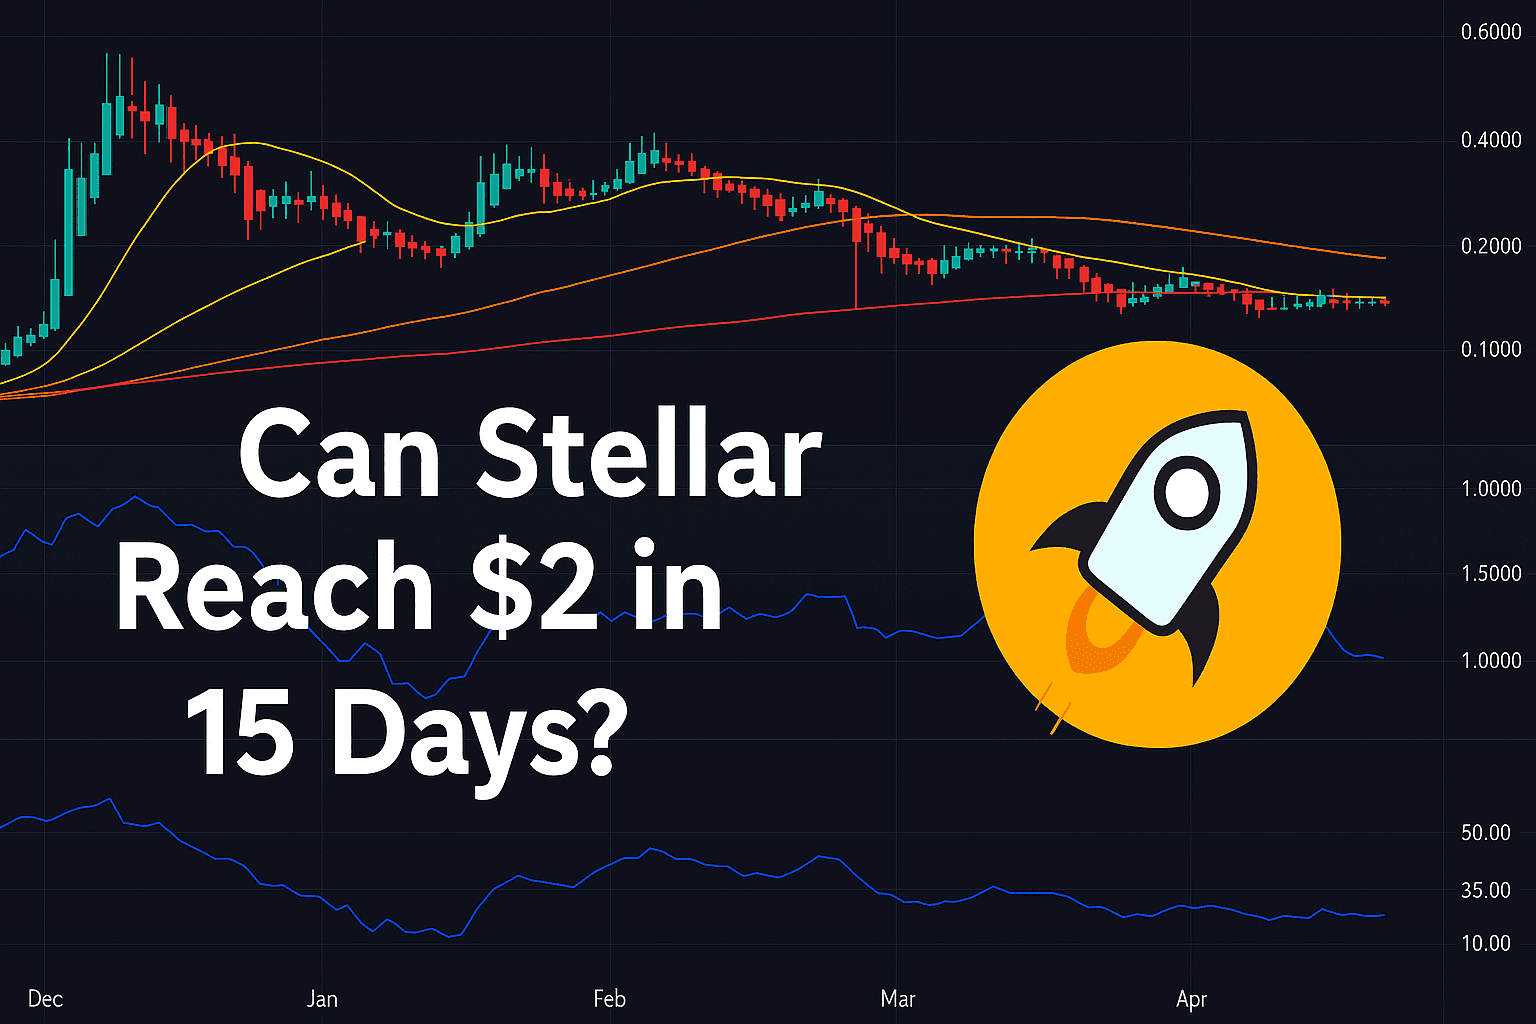
Stellar (XLM) is holding steady around $0.26 – but can it explode to $2 in just 15 days? The chart shows key signs, and the answer might surprise you!

Which topics should we dive deeper into?
Select what genuinely interests you. Your picks feed directly into our editorial planning.
Crypto news that's actually worth your time.
Weekly. 60 seconds. Carefully curated by our editors: no hype, no promo flood, no spam.
Stellar (XLM) has been relatively quiet after its strong performance at the end of 2024, and traders are wondering whether this calm is the calm before a bullish storm—or just a prolonged consolidation. Currently priced at $0.268, XLM is hovering below key moving averages, leading many to ask: Can XLM price really surge to $2 in the next 15 days? Let’s dive into the daily chart to break down the possibilities.
Stellar Price Prediction: Is XLM Gearing Up for a Breakout or Breakdown?

The chart shows Stellar forming a gradual downtrend after its euphoric rally in December 2024, where it briefly peaked near $0.60. Since then, the momentum has slowed considerably. The recent candles are Heikin Ashi, which helps smooth out price action and clearly highlights prevailing trends. Right now, we’re seeing mostly small-bodied candles—signs of market indecision and low volatility.
One critical observation is the compression of price action below the 20-day, 50-day, and 100-day simple moving averages (SMA). The 200-day SMA lies below the current price, acting as a longer-term support at ~$0.28, which XLM price is now dancing around. This suggests a battle between short-term bearishness and long-term structural support. However, the inability to break above even the 20-SMA at ~$0.275 highlights the current weakness in buyer momentum.
What Do the Indicators Say?
The chart includes two critical technical tools:
- MA Ribbon (20, 50, 100, 200 SMA): The moving average ribbon is clearly bearishly stacked—with shorter-term SMAs below longer-term ones, confirming a bearish phase. The price is currently stuck below all key short-term MAs, meaning there’s significant overhead resistance. A bullish breakout would require XLM to first reclaim $0.28, then break above $0.30–$0.35 to reestablish a bullish trajectory.
- Accumulation/Distribution Line (ADL): The ADL currently stands at 1588.39 and shows slight downward slope—indicating that distribution (selling pressure) still dominates over accumulation.There hasn't been a strong surge in volume that would typically precede a bullish breakout, suggesting smart money hasn’t stepped in yet.
Together, these indicators paint a picture of a range-bound asset in a waiting phase, where bulls and bears are in equilibrium—but that could change fast with a news catalyst or Bitcoin-led rally.
Is $2 Realistic in 15 Days?
Let’s be clear: a move from $0.268 to $2 would represent a 645% rally in just two weeks—an extreme and unlikely outcome unless a massive fundamental catalyst occurs, such as:
- A major Stellar adoption announcement
- Integration into a global payments platform
- A broader altcoin season supercycle led by Bitcoin's parabolic rally
Historically, Stellar is capable of sharp vertical moves during speculative bull runs, but we’re not currently in that environment. For XLM price to break $2, it would need to shatter through multiple resistance layers, including $0.30, $0.40, $0.60, $1.00, and $1.50, in rapid succession—all without being rejected. That’s a tall order with current indicators showing low volume, bearish MA alignment, and weak accumulation.
What Price Levels Should You Watch?
If you’re trading or investing in XLM, keep your eyes on the following levels:
- Support: $0.26 (critical short-term support), $0.24 (January low), $0.20 (psychological base)
- Resistance: $0.275 (20-SMA), $0.30 (major resistance), $0.35 (trend reversal confirmation)
A bullish scenario would involve a clean break above $0.30 with volume confirmation, followed by retesting it as support. A bearish scenario would see XLM lose $0.26 and fall back toward $0.24 or lower.
Stellar Price Prediction: Moonshot or Mirage?
While the crypto market is known for its unpredictability, the technicals don’t support a $2 price target within 15 days for Stellar—at least not without an unexpected explosive trigger. The trend is currently sideways-to-bearish, with multiple moving average resistances capping upside momentum and no strong signs of smart money accumulation.
However, if broader market sentiment improves and XLM price manages to break above $0.35 with volume, a short-term rally toward $0.50–$0.60 is within reach. Until then, traders should stay cautious and watch for breakout signals before betting on a moonshot.
Partner links: some links on this page are partner links. If you become a customer through one of them, we may earn a commission at no extra cost to you. Selection, ratings and ranking are decided independently by our editorial team. Ethics and Independence · Ownership and Funding
For later? Save this article and find it again in your profile.
Related articles
- XRP price prediction: will XRP crash to $0.50?
- Bitcoin price back to $100,000 by New Year's Eve? The odds are brutal
- Shiba Inu price prediction: Kraken counts 260 weeks without a close below $0.000004
- Bitcoin price prediction: Mayer Multiple drops to 0.88, 11 percent below the 200-day line
- XRP price prediction: 240 million XRP move at a two-year low, but not to an exchange
Which topics should we dive deeper into?
Select what genuinely interests you. Your picks feed directly into our editorial planning.
Crypto news that's actually worth your time.
Weekly. 60 seconds. Carefully curated by our editors: no hype, no promo flood, no spam.

November 15, 2026 10:37 AM

Crypto Crash Prediction: Where Will 3 Major Coins Bottom Out?
Crypto crash prediction: the key support, the worst-case target and the recovery trigger for three major coins after a brutal week of selling.
November 14, 2026 9:21 PM

Bitcoin price prediction: fear index at 13, and what 12 earlier panics show for BTC
Analysis: the Fear and Greed Index fell to 13 on Saturday, with bitcoin trading at around $65,500 in the evening. We examined the twelve earlier phases with a reading of 13 or lower since 2018, with a clear result for the weeks ahead.

November 14, 2026 7:17 PM

Stellar price falls below $0.14 to its lowest since November 2024, nine days before the Bell vote
Analysis: Stellar (XLM) falls to $0.137 on November 14, its lowest level since November 2024. Nine days before the mainnet vote on Protocol 30, we look at key levels, the Bell upgrade and leverage risk.

November 14, 2026 5:26 PM

XRP drops out of the top 5 and keeps lagging bitcoin
Analysis: XRP has fallen for nine days in a row and now ranks only sixth by market value, behind USDC. The US ETFs turn one, but have not received any new money since October 29.
November 13, 2026 1:27 PM

Ethereum Price Crashes Below $2,000: How Low Can ETH Go?
Ethereum just lost $2,000 for the first time since August. Our ETH chart analysis maps the next support levels and the rebound targets to watch.
November 13, 2026 5:21 AM

XRP price prediction: can record whale wallets offset $18 million in ETF outflows?
Analysis: XRP briefly fell below $1 overnight into Friday. Santiment counts more large wallets than ever, while US ETFs lost $18 million over two days.
November 12, 2026 9:17 PM

Shiba Inu price prediction: funding turns negative as seven in ten accounts stay long
Analysis: funding in the SHIB futures market turned negative on Thursday evening, while seven in ten accounts are still betting on higher prices. What that means for Shiba Inu until Nvidia's results on November 17, and which levels count now.
November 12, 2026 5:28 AM

XRP price prediction: lending protocol has only 63 percent of validators behind it
Analysis: 22 of 35 validators back the XRP Ledger's lending feature, but more than 80 percent are needed. Plus the price at $1.04, the anniversary of the spot ETFs and the levels up to $1.21.

November 11, 2026 7:14 AM

XRP price prediction: funding rate at a 13-month high, what it means for your coins
Analysis: XRP has lost 30 percent since early October, yet leveraged buyers are paying more in funding than at any point in 13 months. Plus the picture for the spot ETFs and the last emptied wallet of the Binance attacker.
November 9, 2026 7:25 AM

XRP price prediction: Korea drives 17 percent of Upbit trading, and $1.08 is the level that decides
Analysis: XRP is the most traded coin on the Korean exchange Upbit, yet buyers there pay no premium over the global market price. Together with empty ETF books, that argues against a quick recovery and puts the $1.08 level at the centre.
November 8, 2026 7:16 AM

Binance XRP scarcity index at a four-year high: XRP price prediction ahead of the weakest weekly close since August
Analysis: XRP is scarcer on Binance than at any point in four years, with CryptoQuant's scarcity index at 2.1. Yet the US spot ETFs took in nothing for an entire week, and at $1.16 XRP is heading for its lowest weekly close since August.
November 7, 2026 7:14 AM

XRP Price Prediction: Long Squeeze Drags XRP to $1.15, the Level That Decides
Analysis: XRP fell to $1.1518 early on Saturday, its lowest level since August 20, after a long squeeze forced $16 million of positions shut. Yet on OKX, 4.3 long accounts still face every short account, and below the price sits a band with almost no trading history.
November 6, 2026 11:24 AM

Shiba Inu Price Prediction: OKX Long-Short Ratio Slides to 2.2 Before Jobs Data
Analysis: on OKX, there are now only 2.2 long accounts for every short account in SHIB, down from 2.8 three days earlier. What the long unwind, the US jobs report at 14:30 German time and the levels between $0.00000412 and $0.00000515 mean for the days ahead.
November 6, 2026 7:31 AM
XRP Price Prediction: Third Test of the $1.19 Zone in Eight Days
Analysis: XRP fell to $1.188 on Friday morning and is testing the zone around $1.19 for the third time since October 30. Futures positioning, Binance reserves and the US jobs report will decide whether it holds once more.
November 5, 2026 11:19 PM

Shiba Inu at Its Lowest Since August: SHIB Price Prediction as the Token Tracks Bitcoin
Analysis: Shiba Inu fell to $0.00000437 on Thursday evening, its lowest level since August 19. What is established is that SHIB fell almost exactly as much as Bitcoin; we assess which levels count below and above.
November 5, 2026 7:36 PM

Stellar Price Below the 200-Day Line: What Counts After 29% Down in 30 Days
Stellar lost 8.5% in 24 hours and 29% in 30 days as the Nasdaq rout hit crypto. The levels that count now, what could turn the picture and how to hedge.
November 5, 2026 2:09 PM

XRP Price Prediction: Down 7 Percent Against Bitcoin, Why the Ratio Says More Than the Price
XRP sits exactly on its 20-day average, but against Bitcoin the coin has lost more than 7 percent in 30 days. Why the ratio to Bitcoin says more than the dollar price right now and which levels count for the XRP price prediction.
November 5, 2026 1:09 PM

Cardano Price Prediction: Down 26.5 Percent in 30 Days, the Levels ADA Must Hold Now
Cardano lost 26.5 percent in 30 days, four times as much as Bitcoin. Now the 20-day and 200-day averages sit almost at the same price right above the market. Why this zone decides and which scenarios follow for ADA.
November 2, 2026 7:33 PM

US Midterms Tomorrow: 5 Scenarios for Bitcoin, XRP and Solana
America votes on Tuesday and crypto has over 170 million dollars riding on it. Five election outcomes and what each one would mean for Bitcoin (BTC), XRP and Solana (SOL) prices.
October 29, 2026 9:17 PM

Curve launches StableSwap on Stellar: what it means for XLM and custody
Curve Finance launched StableSwap on the Stellar mainnet on October 29, its first native deployment outside the EVM world. What the step means for the XLM price, your custody and the tax on every swap.
October 27, 2026 12:31 PM
XRP Price Crashes Below $1.30: What Caused It and What Comes Next
XRP price has dropped below $1.30 after weeks of selling. Here are the factors behind the XRP crash and the next high and low price targets.
October 15, 2026 1:16 PM

Chainlink goes live on Stellar: LINK price falls 6 percent to $12.13
Chainlink has put its Data Feeds into operation on Stellar, reaching a network with billions in tokenised assets. The LINK price gives up 6.12 percent on the same day - why network expansion and token demand drift apart.
October 7, 2026 10:15 PM

6.3 Percent Down, the 20-Cent Level Tested: What You Can Do Now About Stellar (XLM)
Stellar falls 6.27 percent to $0.20048 on October 7, 2026, and has traded below the round 20-cent mark for the first time at the day's low. A market-wide pullback with a liquidation wave in the futures market carries the decline; at Stellar itself there is no trigger of its own.
September 29, 2026 4:14 AM

Stellar rises more than 8 percent as the network clears 41 transactions per second: what you can do now
XLM climbs 8.1 percent in 24 hours to $0.2329. We measured 999 ledgers and 2,000 transactions on the Stellar network: 41 transactions per second, a 22.4 percent failure rate and a fee that most often matches the minimum rate exactly.
September 25, 2026 10:11 AM

Stellar Climbs to $0.22: Why 446 Tokens Are Called USDC and What XLM Holders Must Check Now
Stellar Lumens gains 9.66 percent within 24 hours to $0.2212, carried by almost $4 billion of tokenized real-world assets on the chain. Our own count of September 25 shows at the same time why a stablecoin ticker on Stellar says nothing about its issuer.
September 24, 2026 1:11 PM

Stellar Becomes a Payment Rail at Mastercard's BVNK: What XLM Holders Should Check on Buying Route, Memo and Holding Period
BVNK has switched on Stellar as a payment rail for business customers in more than 130 countries. On the same trading day XLM falls by around seven percent — we separate what the news means from what the pullback means for your portfolio.
September 19, 2026 10:11 AM

Stellar Tops $0.19: What XLM Holders Should Check After the Protocol 28 Upgrade
Stellar has reclaimed the $0.19 mark and stands 5.57 percent above the previous day, while the network has been running on protocol 28 since September 16. We pulled the price and the protocol version ourselves and show what is market movement and what you should actually check on minimum reserve, memo, staking promises and holding period.
More from CryptoTicker