
PEPE Price Prediction: Triangle Breakout Could Send PEPE Coin Flying
PEPE coin is forming a clear triangle pattern as it drops 8% this week. Could this setup trigger a major breakout once Bitcoin stabilizes below $123K?


Which topics should we dive deeper into?
Select what genuinely interests you. Your picks feed directly into our editorial planning.
Crypto news that's actually worth your time.
Weekly. 60 seconds. Carefully curated by our editors: no hype, no promo flood, no spam.
PEPE’s Triangle Pattern Sparks Breakout Hopes
After a volatile week that saw $PEPE drop nearly 8%, traders are eyeing what could be a major technical setup forming on the charts. The memecoin’s price action now shows a triangle pattern — a classic sign of compression before a big move.
Meanwhile, Bitcoin’s pullback from its all-time high above $126K to below $123K has added pressure to the broader crypto market, leaving many wondering: will PEPE break out next?
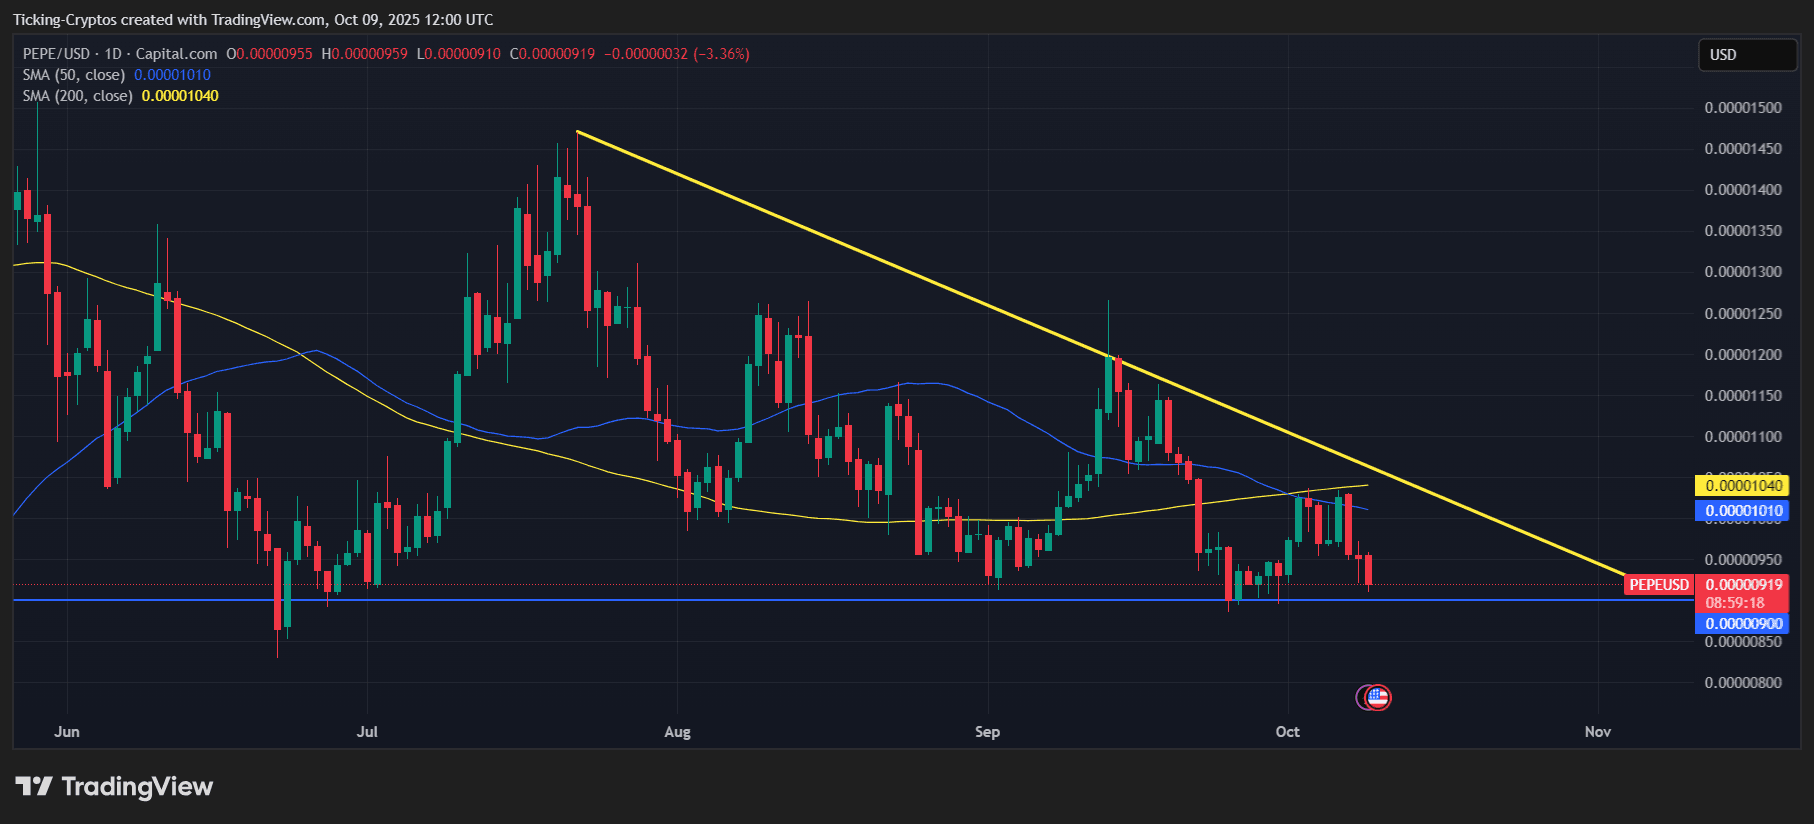
PEPE/USD 1-day chart - TradingView
PEPE Price Under Pressure — But Momentum Is Coiling
PEPE’s current structure shows a descending resistance line converging with a horizontal support zone around 0.00000900, forming a textbook triangle pattern. Here’s the technical breakdown:
- Current Trend: PEPE remains in consolidation, making lower highs under a descending trendline.
- Key Support: The 0.00000900 zone continues to hold, despite repeated tests this week.
- 50-day and 200-day SMAs: Sitting near 0.00001010 and 0.00001040, these levels act as critical resistance — a breakout above could signal the start of a bullish reversal.
- Volume: Decreasing volume often precedes volatility spikes — reinforcing the triangle’s “coiling spring” setup.
- Interpretation: The pattern suggests that PEPE is building energy for a significant move. A break above the upper trendline could ignite bullish momentum, while a drop below support may accelerate the decline.
Bitcoin’s Cooldown Is Setting the Stage
The recent Bitcoin retracement from $126K to below $123K reflects a healthy price adjustment after record highs. However, this short-term cooldown has spilled into the memecoin market.
Historically, PEPE’s volatility amplifies Bitcoin's direction — meaning once $BTC stabilizes, PEPE could move sharply in either direction.
If Bitcoin regains strength, traders expect PEPE to rally faster due to pent-up momentum and speculative appetite returning.
Key Levels to Watch for PEPE Coin
| Level | Type | Action Zone |
|---|---|---|
| 0.00000900 | Support | Main defense; a break below targets 0.00000860–0.00000850 |
| 0.00001010 | Resistance (50-DMA) | First bullish trigger if reclaimed |
| 0.00001040 | Resistance (200-DMA) | Momentum confirmation point |
| 0.00001150 | Breakout Target | Confirms triangle breakout |
| 0.00001220–0.00001300 | High Target Zone | Post-breakout upside zone |
PEPE Price Prediction: What Happens Next
Bullish Scenario — Breakout Imminent
If PEPE breaks above 0.00001010–0.00001040, the triangle breakout could send the memecoin flying.
- Short-term targets: 0.00001150 → 0.00001220 → 0.00001300
- Catalyst: Bitcoin recovery above $124K and renewed memecoin inflows
Neutral Scenario — More Coiling
PEPE may oscillate between 0.00000900 and 0.00001010, tightening further before the breakout.
This would extend the triangle’s apex into mid-October, increasing the likelihood of a volatile resolution once it snaps.
Bearish Scenario — Breakdown Risk
A daily close below 0.00000900 would invalidate the bullish triangle and point to further downside.
- Next supports: 0.00000860 → 0.00000800
- Catalyst: Bitcoin slipping below $122K or risk-off sentiment across altcoins.
Bottom Line
PEPE’s triangle formation signals a make-or-break moment. After an 8% dip this week and $Bitcoin brief correction, the stage is set for a major move.
If bulls reclaim key moving averages, $PEPE could break free from its consolidation and fly toward 0.000012–0.000013. But failure to hold the 0.000009 support risks another leg down.
The pattern is clear — PEPE’s next big move is just around the corner.
Partner links: some links on this page are partner links. If you become a customer through one of them, we may earn a commission at no extra cost to you. Selection, ratings and ranking are decided independently by our editorial team. Ethics and Independence · Ownership and Funding
Related articles
- Shiba Inu price prediction: Pepe trades 14 times SHIB's daily volume
- Shiba Inu price prediction: is $34.6 million in daily volume enough?
- BNB Crash: Binance Coin Drops 6% After the Hack. Is This Another FTT Moment?
- Solana Crash: SOL Falls Below $100. Is $80 Next?
- Bitcoin price prediction: dominance at 60.2 percent, Polkadot down 13 percent: which levels decide now
Which topics should we dive deeper into?
Select what genuinely interests you. Your picks feed directly into our editorial planning.
Crypto news that's actually worth your time.
Weekly. 60 seconds. Carefully curated by our editors: no hype, no promo flood, no spam.

October 15, 2026 7:22 AM

Cardano breaks the $0.2439 level: ADA is falling more than twice as fast as Bitcoin
Cardano has lost 7.13 percent over 24 hours to $0.2207 and now stands at its lowest since September 18. Bitcoin gave up only 2.95 percent in the same period, and our own count shows 15 of the 20 largest coins falling harder than BTC.
October 4, 2026 1:31 PM

90 US banks now settle over Solana in 400 milliseconds: what it means for the SOL price
Since October 1, more than 90 banks and credit unions in North Dakota have been settling transfers with a stablecoin over Solana, provided by Fiserv, and a record in tokenised equity trading comes on top. What that means for the SOL price and which levels count.
October 3, 2026 10:38 AM

44 Percent Below the Record: BNB's 37th Burn Follows in Mid-October
A year ago BNB stood at $1,370; today it is around $767. The price has been swinging between $750 and $800 for weeks, and the next quarterly burn is due around the anniversary of the record. Here are the levels that count and what the burn actually does.
September 28, 2026 4:38 PM

Shiba Inu Price Prediction: What Matters Now That Shibarium Handles 1,680 Transactions a Day
Shiba Inu trades at $0.0000056 on September 28, 2026, and its own layer-2 chain Shibarium processes around 1,680 transactions a day after the reorg fix, against 4.69 million in August 2025. This piece sets out which figures actually carry a SHIB forecast today and what follows from them for buying, custody and tax in Germany.

September 21, 2026 4:15 PM

Sui Jumps 26 Percent: The Strongest Coin In The Top 30
Sui gains around 26 percent within 24 hours and beats every other asset in the top 30. Behind the move sit a prominent bet on the AI economy, a new bitcoin protocol and a rotation into layer 1 chains.
September 20, 2026 1:27 PM

Why Is PEPE Rising Right Now? Three Explanations Circulate, None Is Documented
PEPE has been up by double digits for a week, and three reasons for it are doing the rounds online: whales are buying, a fund is coming, a large buyback is due. We checked all three. What the data really says, and how you tell whether a crypto report is worth anything.
September 11, 2026 8:32 AM

Bitcoin Price Drops 4% in a Week, and the Chart Just Got Interesting
Bitcoin price fell 4% this week and lost the $78,000 shelf. Here is what the chart says about the next support, resistance and price targets.
August 25, 2026 3:56 PM

Bitcoin Price Cracks $80,000 Then Cools While Altcoins Push Higher
Bitcoin cleared 80,000 dollars for the first time since May, then slipped to 79,100. Chart analysis, upside targets and key support levels.
August 21, 2026 6:07 PM
Bitcoin Cash Explodes 29% In A Day: Why BCH Outperformed BTC?
Bitcoin Cash jumped 29.41% to $288, the biggest daily gain of any major coin. The reason has almost nothing to do with Bitcoin Cash itself.
August 21, 2026 5:08 PM

Ethereum Price Above $2,300: 3 Reasons Why ETH Is Leading This Rally
Ethereum jumped past $2,300 and is now testing $2,400. ETH is outpacing Bitcoin, and the reasons are specific to Ethereum.

July 21, 2026 10:21 AM
Crypto Market Rebounds: Bitcoin Reclaims $66K and Ethereum Tops $1,900 as Inflation Fears Ease
Bitcoin is back above $66,000 and Ethereum has topped $1,900 as secondary inflation fears fade and ETF inflows return. Here's what's driving today's rally.
July 10, 2026 3:04 PM
Zcash Surges 8% as the Ironwood Upgrade Reignites Privacy-Coin Hype
Zcash is up more than 8% today and back above $500. Here is what is driving the ZEC rally and where analysts see the price heading next.
June 5, 2026 3:00 PM

Zcash Crash: ZEC Coin Falls 40% After AI Bug Scare — Here Are the Next Supports
Zcash crashes over 40% as AI-linked bug fears, whale shorts, liquidations, and weak crypto sentiment hit $ZEC.
June 5, 2026 10:49 AM
Bitcoin Price Breaches $63,000 as Liquidations Deepen, But the Next Move is Worrisome
Bitcoin has breached the critical $63,000 mark as derivative liquidations deepen, signaling a potentially more worrisome structural breakdown ahead.
June 5, 2026 9:59 AM

Ethereum Prediction: ETH Coin Falls Below $1,700 – Here Are the Next Supports
Ethereum has crashed below the critical $1,700 level amid a broader crypto selloff. Technical analysis reveals the next crucial targets for ETH price.
May 19, 2026 6:47 PM

Is Ethereum a Bad Investment? Price Analysis and Future Outlook
Ethereum trades at $2,116, sparking fear among holders. Is ETH a bad investment, or are macro pressures masking a strong long-term buy signal?
May 13, 2026 11:02 AM

Is PEPE Coin worth Buying in 2026?
PEPE still holds both its 50 day and its 200 day average, while the past month has gone sideways and weekly turnover has picked up again. What that means for anyone buying at current prices, and the two levels that settle it.
April 30, 2026 1:00 PM
XRP Price Prediction May 2026: Will XRP Coin Reclaim $1.80?
XRP enters May 2026 with strong ETF inflows and a critical technical setup. Here are the high and low targets for the XRP coin this month.
April 26, 2026 3:14 PM
Will Ethereum Coin Break its $4,900 ATH in 2026?
Ethereum eyes a potential return to its $4,900 ATH in 2026. Discover the technical hurdles and institutional catalysts driving the current ETH price action.
April 24, 2026 3:29 PM
XRP Price Prediction: Why Ripple is Stuck in a Sideways Grind
XRP price remains stagnant despite regulatory wins. This XRP price prediction analyzes the technical chart and identifies the key breakout levels for 2026.
April 23, 2026 4:25 PM

Ethereum Price Analysis: ETH Coin Targets $2,500 as Bulls Defend a Strong Support
Ethereum holds firm above $2,300 while Bitcoin leads the rally. Technical analysis suggests a potential ETH coin breakout toward $2,500 in the coming days.
April 22, 2026 9:11 AM
Bitcoin Price Hits $78,000 as Ceasefire Extension Ignites Bullish Momentum
Bitcoin breaches $78,000 following the US-Iran ceasefire extension and a $2.5 billion MSTR purchase. Here is the weekly BTC chart for key 2026 price targets.
February 17, 2026 8:06 AM

PEPE Price Prediction: 23% Surge Ignites Recovery as Bitcoin Reclaims $70k
PEPE price jumped 23% as Bitcoin hit $70,000. Analyze the technical breakout, whale accumulation, and why this memecoin remains a high-volatility leader in 2026.
January 13, 2026 10:11 AM

PEPE Was Up 50% in Early 2026: Did PEPE Coin Break the Descending Triangle?
PEPE gained about 50% in the first days of 2026 and pressed against a descending triangle. It broke lower instead: the support at $0.0000040 gave way and PEPE fell to about $0.0000023 in July.
More from CryptoTicker