Bitcoin Price Breaches $63,000 as Liquidations Deepen, But the Next Move is Worrisome
Bitcoin has breached the critical $63,000 mark as derivative liquidations deepen, signaling a potentially more worrisome structural breakdown ahead.


The digital asset market is facing a severe wave of deleveraging, forcing Bitcoin ($BTC) to give up the critical $63,000 support level. Broad macroeconomic tightening, driven by persistent inflationary pressures and delayed interest rate cut expectations from the Federal Reserve, has severely weakened risk appetite. Furthermore, a rotation of capital into high-growth technology equities alongside persistent spot ETF outflows—which recently marked a record $4.4 billion multi-day exodus—has accelerated the downward momentum.
 Bitcoin is under heavy pressure: how low could BTC go next? Discover the key support zones and potential price targets in our analysis
Bitcoin's structure is heavily skewed to the downside, with sellers maintaining firm control over the short-term trend. While the breach below $63,000 has already shaken retail confidence, technical data indicates that the next structural move could be far more worrisome for market bulls.
Bitcoin Price Analysis: BTC Coin Slides Under $63,000
The continuous decline of $Bitcoin has systematically dismantled major psychological thresholds over the last month. After failing to sustain its positioning within the $70,000 and $66,000 handling zones, heavy distribution took over. This triggered severe cascading liquidations across crypto derivative platforms, amounting to over $3 billion in wiped-out market leverage within a two-day window.
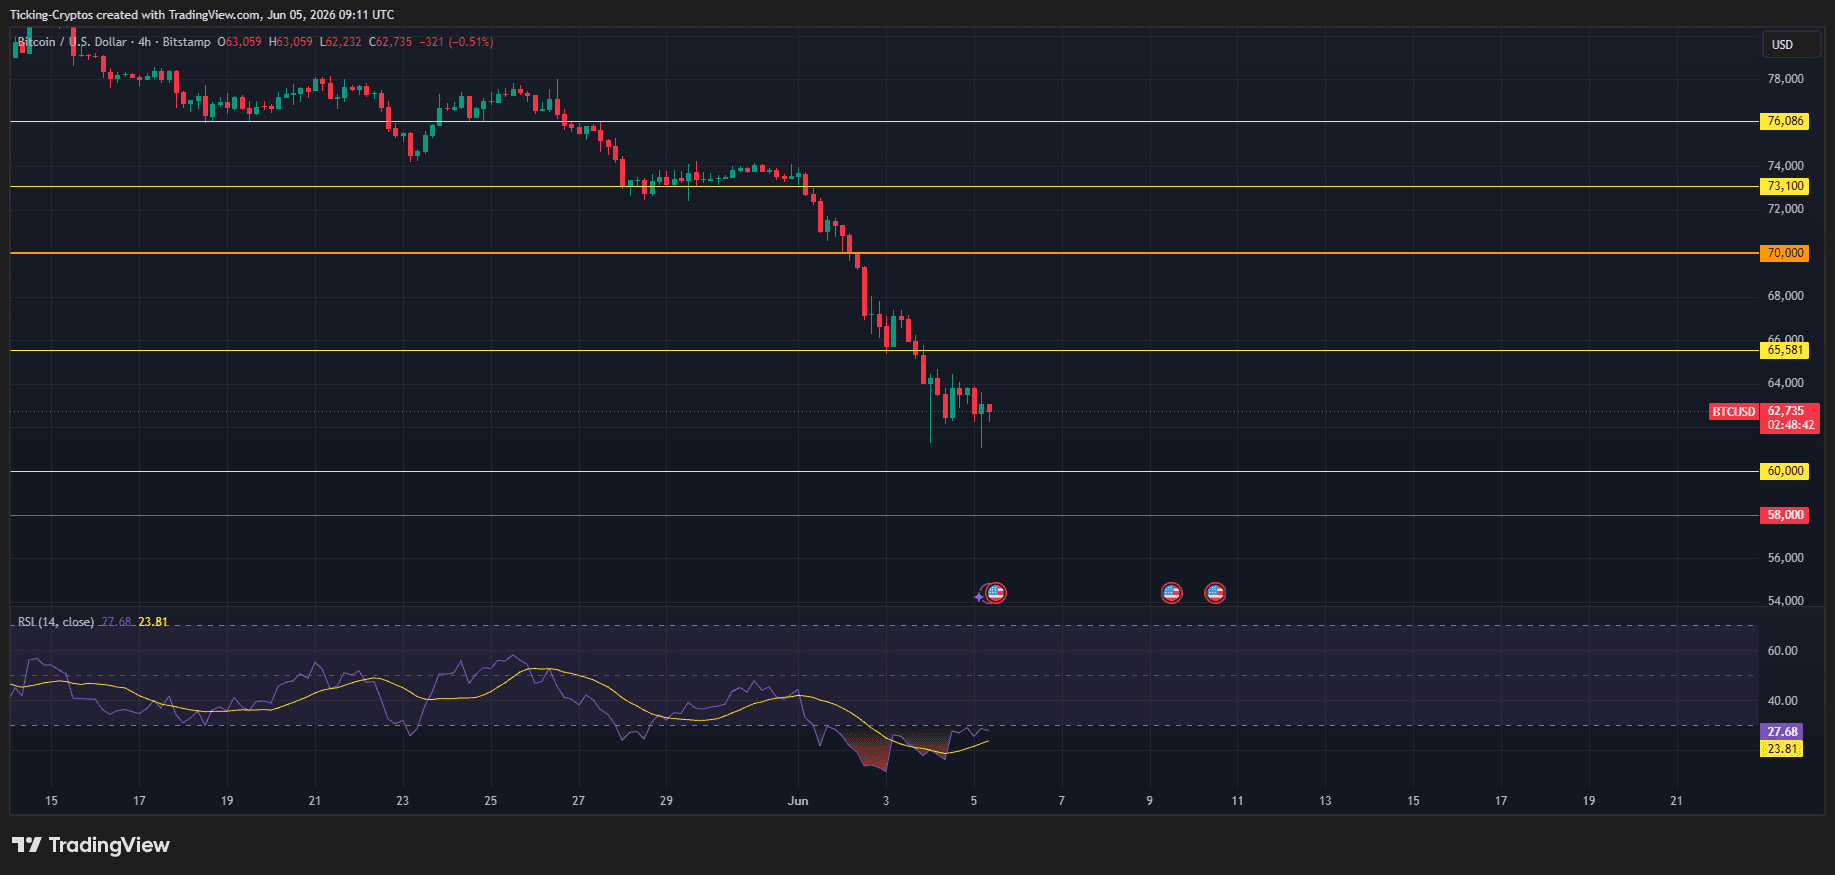
As depicted by live market action, BTC pushed down to an intraday low of $62,232 before experiencing minor structural consolidation toward $62,735.
- The RSI Factor: The 14-period Relative Strength Index (RSI) on the 4-hour chart is firmly embedded inside the oversold territory, printing a low reading of 27.68.
- Market Sentiment: Typically, an RSI falling below the 30 boundary suggests an asset is locally overextended to the downside. However, the accompanying volume spikes indicate aggressive spot distribution rather than a clean exhaustion of sellers, meaning a sudden trend reversal is not yet confirmed.
Why the Next Price Move is Worrisome
The breakdown below $63,000 is not just a localized correction; it signals a fundamental breakdown of the multi-month accumulation range. Market analysts point to several compounding technical factors that make the immediate outlook highly precarious.
1. Moving Average Convergence Flips to Resistance
Bitcoin remains pinned below its 20, 50, and 100-day moving averages. The velocity of the latest drop has widened the gap between the spot price and these core indicators, meaning any short-term relief rally will face immense overhead selling pressure at every minor step upward.
2. Institutional capitulation and ETF Outflows
The primary engine of the 2024–2025 bull cycle was consistent institutional demand via spot ETFs. The reversal of this trend into a historic 13-day outflow streak demonstrates that institutional risk metrics are forcing a reduction in crypto exposure. Without institutional buyers absorbing spot supply, order books remain thin and highly vulnerable to flash crashes.
💡Tip: Turn volatility into a long-term advantage
Market downturns often feel uncomfortable, but they can be some of the best opportunities for long-term investors. Instead of trying to time the market, a crypto savings plan lets you invest a fixed amount regularly and benefit from dollar-cost averaging (DCA). This means you automatically buy more crypto when prices are low and less when they are high, smoothing out volatility over time.
Start your Bitcoin savings plan today and steadily build your portfolio through every market cycle.
3. Macro Headwinds: Inflation and the Fed
Macro factors continue to act as a significant drag. Rising global crude oil prices, fueled by ongoing geopolitical tensions, have driven up corporate production and transportation costs. This sticky inflation has effectively erased the Federal Reserve's near-term rate-cut plans, with some officials even floating the possibility of interest rate hikes. Higher-for-longer interest rates structurally drain liquidity away from speculative risk assets like cryptocurrencies and redirect it toward traditional yield-bearing instruments.
 Crypto markets are under heavy pressure — but for many investors, this is where the real opportunities begin. Discover the best crypto exchanges and take advantage of current market movements
Bitcoin Price Prediction: Next Critical Support Targets for BTC
With the $63,000 baseline now flipping into immediate overhead resistance, market observers are watching key horizontal support bands to evaluate where a macro price floor will settle.
Immediate Support: $60,000
The primary line in the sand for bulls sits directly at the $60,000 psychological milestone. According to multi-month trading data, this area represents a historic liquidity pocket where buyers have previously formed a defensive line. If $60,000 is invalidated on a weekly closing basis, it will likely spark an additional wave of automated stop-loss liquidations.
Macro Capitulation Floor: $58,000
Should macroeconomic or geopolitical conditions deteriorate further, the ultimate major defense line rests at $58,000. A descent into this territory would signify a deeper market capitulation, resetting open interest metrics completely before an organic base can be constructed.
Key Overhead Resistance: $65,581 and $70,000
For Bitcoin to neutralize its current bearish structure, the bulls must forcefully reclaim the $65,581 resistance line. Breaking above this level would provide the technical validation needed to shift short-term momentum and open the door for a retest of the major $70,000 supply zone.
Current Crypto Prices at a Glance
The systemic selloff has triggered broad-based declines across all high-market-cap digital assets. Based on aggregate market data, here is how the top cryptocurrencies are performing:
- Bitcoin ($BTC$): $62,735.00
- Ethereum ($ETH$): $1,664.72
- Binance Coin ($BNB$): $588.39
- XRP ($XRP$): $1.12
- Solana ($SOL$): $65.57