
Bitcoin price prediction: a 6 percent range in Fed week, what you can do now
Analysis: Bitcoin stands at $80,302 at Tuesday midday, and the range of the past 30 days has fallen to 10.2 percent, the tightest reading since mid-August. What the three comparable phases since November 2024 say about the next trading days, and which levels frame the corridor.





Which topics should we dive deeper into?
Select what genuinely interests you. Your picks feed directly into our editorial planning.
Crypto news that's actually worth your time.
Weekly. 60 seconds. Carefully curated by our editors: no hype, no promo flood, no spam.
The Bitcoin price stands at $80,302 at Tuesday midday, and the more telling number is not in the price but in its movement: only 10.2 percent now separates the highest and the lowest level of the past 30 days. Measured on daily closes over the past two weeks it is just 5.0 percent. The market is trading as tightly as it last did in mid-August, and on Wednesday evening the US central bank decides on its key rate.
For the coming days that points to one clear thing: a phase like this rarely ends with another quiet day. Where the price can point over a horizon of months is set out in our Bitcoin price prediction. This piece deals with the shorter term: with the squeeze itself, with what followed it in comparable cases, and with the levels that will show how it resolves.
Bitcoin at $80,302: the market was last this tight in August
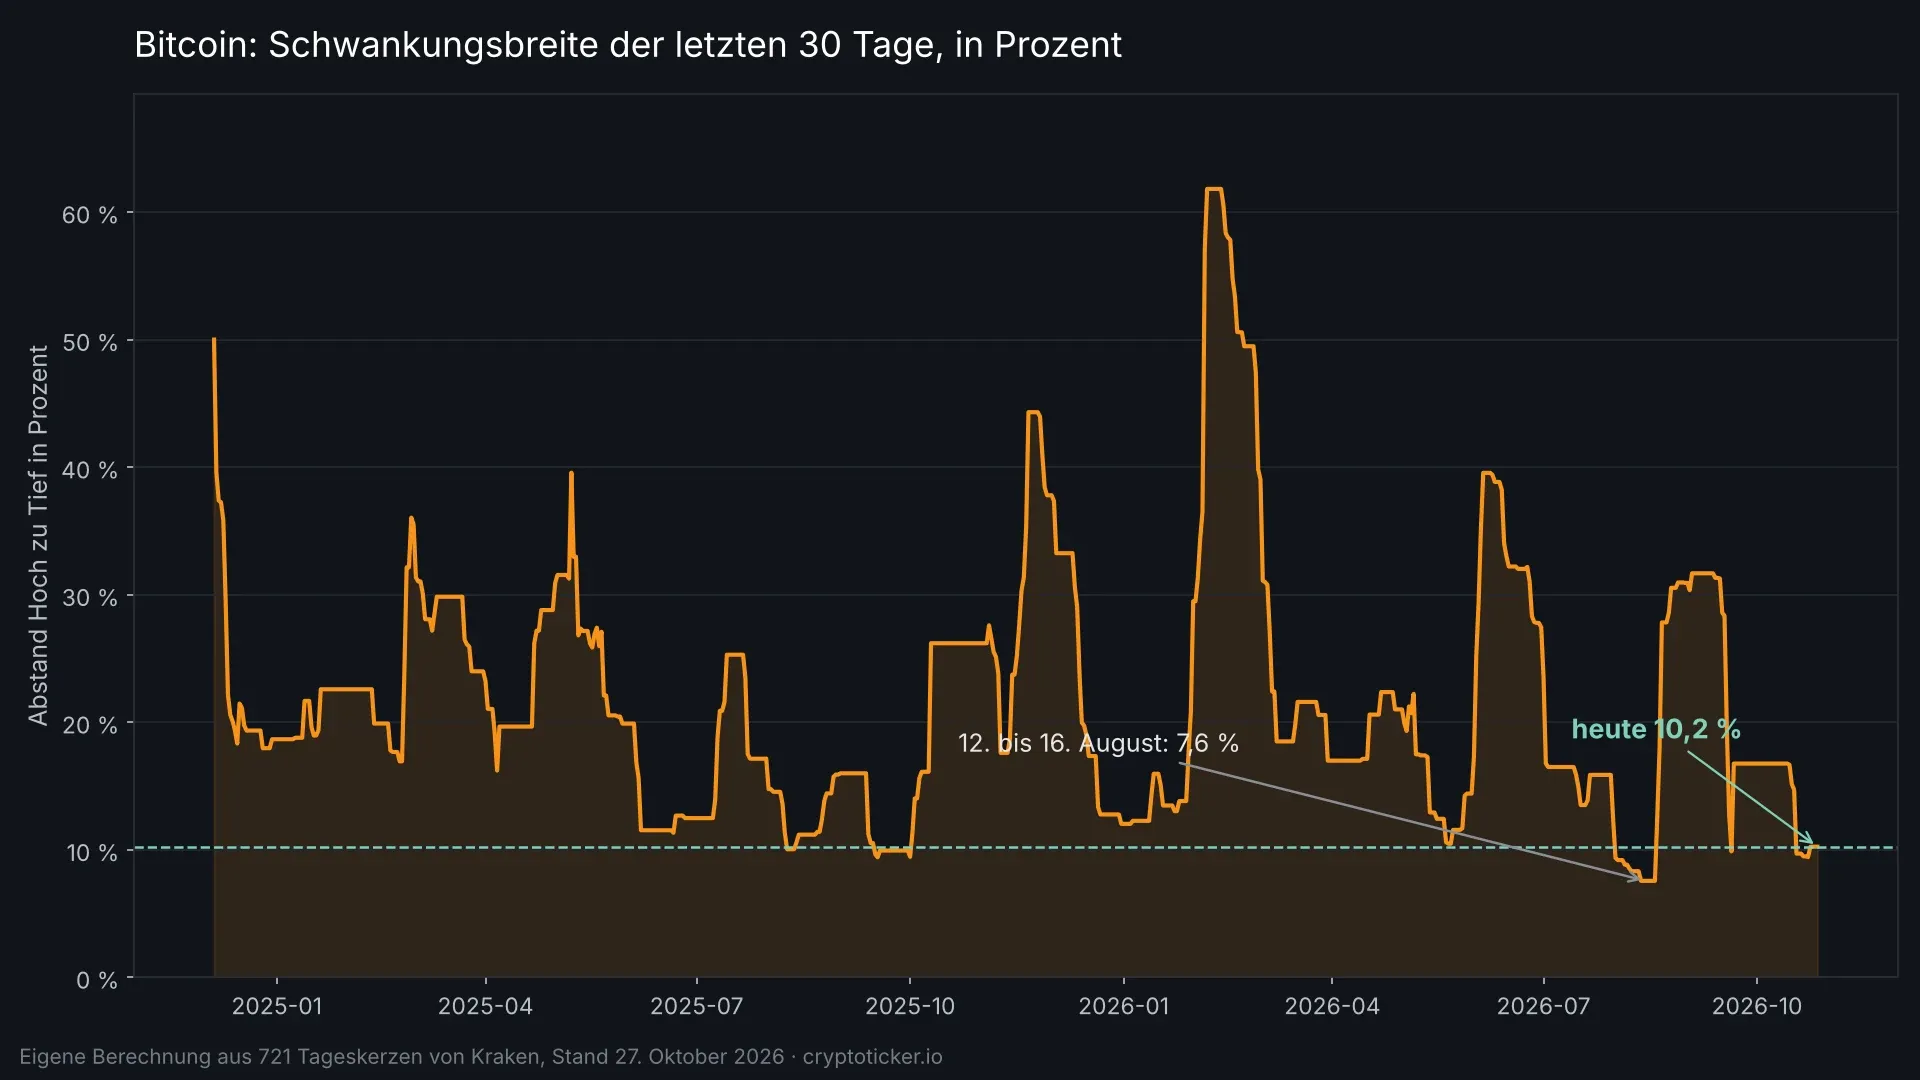
On Tuesday the price moved between $79,378 and $80,302, a daily range of 1.2 percent. Over the past 14 days daily closes fluctuated between $80,002 and $84,022. A comparison with the rest of the year shows how unusual that is: in February 2026 the 30-day range stood above 60 percent, in June at around 40 percent.
Analysts at Secure Digital Markets in Ontario put the decline at a move from 13 to 6 percent in their daily note, quoted by CoinDesk. Their measurement covers a slightly different window than ours, but the direction is the same. Their conclusion reads: “A volatility squeeze of this kind often ends with a sharp move.”
Where the numbers come from: two years of daily candles in our own dataset
Every range in this piece comes from our own dataset of 721 daily candles from the exchange Kraken, trading pair BTC against the US dollar, pulled on October 27. For every trading day since November 6, 2024 we looked for the highest high and the lowest low of the preceding 30 days and calculated the gap between them in percent. The result is the curve in the chart above.
The calculation yields a finding that can be counted back: on 49 of 692 measurable trading days the range stood at 10.2 percent or below. That is 7.1 percent of all days. Bitcoin therefore sits in the tightest twentieth of its bandwidth over two years. The tightest phase of all fell on August 12 to 16, 2026, at 7.6 percent.
Volatility squeeze: what happens when the range converges
A volatility squeeze describes a phase in which buyers and sellers settle on a narrow price range and neither side musters enough weight to leave it. The mechanism behind it is no secret: the longer such a phase lasts, the closer the stop levels of both sides creep towards the edge of the range. Once the price breaks out in one direction, those levels trigger in series and amplify the move.
Add to that the derivatives market. Traders who bet on continued calm sell options inside a narrow range and earn on the movement that fails to arrive. If the price jumps, they have to hedge their positions in the live market, and in the direction of the breakout. A nudge turns into a thrust. That is what Secure Digital Markets means by a sharp move, and it is why a tight range says something about the force of the next move and nothing about its direction.
The August case: 7.6 percent of tightness turned into 24.7 percent in five days
The most recent comparable phase lies a good two months back. From August 12 to 16 Bitcoin traded with a 30-day range of 7.6 percent, the tightest reading in our entire dataset. The close on August 16 was $62,819. Five trading days later, on August 21, the price stood at $78,327. That is a gain of 24.7 percent.
Ten days after the end of the tight phase it was $79,009, or 25.8 percent. August closed up 25.1 percent, making it the strongest month of the past two years. Reading that squeeze as calm was the wrong call.
 Compare exchanges for your Bitcoin buy
The September 2025 counter-test: the squeeze resolved to the downside
A single case proves nothing, hence the counter-test. On September 17, 2025 the 30-day range stood at 9.4 percent, tighter still than today. The close was $116,469. Five trading days later Bitcoin was quoted at $112,748, down 3.2 percent. After ten days it was $109,720, or 5.8 percent lower.
The third case sits in between. On October 1, 2025 the range measured 9.5 percent at a level of $118,600. Over the following five days the price rose to $124,766, the highest daily close to date. Ten days later it stood at $110,775, 6.6 percent below the starting point. The move came, it came fast, and it turned on the way.
Three cases yield no hit rate, and we claim none. What they do yield is an order of magnitude: in all three the price moved at least 5.8 percent within ten trading days, in one case by more than 25 percent. Measured against today's level of $80,302, that would imply a range between roughly $75,600 and $85,000 as a modest scenario.

$80,000, $75,000 and $73,000: the levels from Secure Digital Markets
Secure Digital Markets names three concrete levels in the same note. The most important support lies in the zone around $80,000. A break below it opens the way first to $75,000 and then to $73,000. At Tuesday midday the price sits $302 above the first of those levels, around 0.4 percent.
Those levels differ from the ones examined on Monday in our prediction on the October month-end. That piece looked at $79,332, $80,825 and $83,576, in other words the question of whether the month closes green or red. The price has barely moved since, standing at $80,283 at Monday midday. What has changed is the range: it has narrowed further since Monday, and the upper of the three levels, $83,576, is now 4.1 percent away.
Anyone planning to buy or sell in this setup should know the costs that sit between the quoted price and execution. The fee models of licensed providers lie far apart; the crypto exchange comparison shows the spread from flat pricing to maker-taker models. In a tight market phase, the fee difference weighs more heavily in percentage terms than in a rally.
The 200-day line at $72,986 backs the lower level
The second target level from Secure Digital Markets gets support from our own calculation. The moving average of the past 200 daily closes stands at $72,986 on October 27, close to the $73,000 cited. The price is quoted 10.0 percent above it.
The 50-day line sits at $81,797, and that is where the lid is: since October 22 Bitcoin has closed below it for the sixth trading day in a row. When that break happened on Saturday for the first time in 66 days, it was open whether it amounted to more than a slip. What is new since then is that it holds. The 100-day line runs at $75,600 and therefore falls almost on the analysts' first target level.
That produces a corridor derived from moving averages alone: $81,797 at the top, $72,986 at the bottom, with $75,600 as an intermediate step. Today's price sits in the upper third of that corridor.
What the options market is pricing in for Wednesday evening
The two-day meeting of the Federal Open Market Committee has been running since Tuesday, with the decision published on Wednesday evening Central European time. The dates are listed in the Fed's meeting calendar. What is striking is how little the options market expects from it: the platform Derive puts the cost of an at-the-money options strategy running to Friday's expiry at around $2,400, which corresponds to a priced-in move of roughly 3 percent either way. Derive itself calls that “nothing out of the ordinary”.
Three percent on today's level is $2,409. To the upside that leads to $82,711 and therefore above the 50-day line, to the downside to $77,893 and therefore below the $80,000 zone. The options market is pricing in a move that touches both edges of the tight area without clearly leaving either of them.
 Find a tax tool for your holding period
FxPro and Galaxy: two camps, two arguments
On direction the assessments diverge, and both sides give their reasons. Alex Kuptsikevich, chief analyst at the broker FxPro, wrote in an email cited in the market report by CoinDesk: “Technical indicators suggest the downtrend is set to continue.” That matches the break of the 50-day line and the 36.3 percent distance to the all-time high at $126,080.
Alex Thorn, head of research at Galaxy, argues the opposite in the same source: “We think the bear market ended in June and that bitcoin is in the accumulation phase that has preceded every prior advance.” Supporting that reading are the June low at a monthly close of $58,532 and the 37.2 percent recovery since.
Both statements are the opinions of their authors, not facts. What can be measured stands above: the corridor, the range, the three comparable cases.

Holding period and cost basis: what a sale in the squeeze triggers
A quiet market phase is the sensible moment to put the tax position in order, because there is time for it. In Germany the one-year holding period under section 23 of the Income Tax Act still applies to crypto assets held privately: hold a unit for more than twelve months and sell it afterwards, and the gain carries no income tax. Sell within the period and the gain is taxed at the personal rate, provided the exemption threshold of 1,000 euros in the calendar year is exceeded.
What decides the matter is which units are allocated to the sale. Someone who bought in February 2026 at around $67,000 only reaches the one-year mark in February 2027. A sale during an upside breakout this week would therefore be taxable, a sale next February would not. That calculation only works if the acquisition data is complete, and that is exactly where it tends to fail when it matters. A tax tool that pulls together transactions from exchanges and wallets and sorts them by the method your tax office expects takes that work off your hands.
A second point concerns custody. A transfer from an exchange to your own wallet is not a sale and does not reset the holding period. Anyone who wants to sit out the coming move can therefore shift their holdings now without triggering tax consequences. Document the transfer times anyway, because you need them as evidence of the acquisition dates.
Our assessment: the squeeze is documented, the direction is not
Documented is this: the 30-day range stands at 10.2 percent and therefore in the tightest twentieth of 692 measured trading days. The 50-day line has capped at $81,797 for six days, the 200-day line supports at $72,986. The options market is pricing in around 3 percent of movement around the Fed decision. In all three comparable phases since November 2024, a move of at least 5.8 percent followed within ten trading days.
Our assessment: a resolution to the upside currently has a harder job than one to the downside, because it first has to clear the 50-day line, while on the way down the next line only waits at $75,600. Against that stand Galaxy's reading and the fact that the three monthly balances since July all came out positive, most recently at 6.4 percent in September. We therefore expect a move this week but do not commit on direction, because the data does not support it. If you read a prediction that names a direction while citing the same numbers, ask for its reasoning.
October currently stands at a loss of 3.9 percent against the September close of $83,565. That would make it the second October in a row to end negative, after the month closed 3.9 percent down in 2025.
Bitcoin corridor: $72,986 at the bottom, $81,797 at the top
Three steps worth taking this week:
- Note down both edges. $81,797 at the top as the 50-day line, $80,000 at the bottom as the next support and $72,986 as the 200-day line. Anyone planning an order should know beforehand at what fees it will be executed; the crypto exchange comparison lists the models of the providers licensed in Germany.
- Sort out the cost basis. Record the acquisition date and acquisition price for every position, so that before a sale you know whether the one-year mark has been reached. The providers in the crypto tax software comparison handle the reconciliation with your exchange statements.
- Measure leveraged positions against the priced-in 3 percent. A move of that size liquidates any position with double-digit leverage that sits close to the market. If you hold derivatives, know the distance to your liquidation level; the terms and liquidation rules of the platforms are in the perp DEX comparison.
(As of October 27, 2026. This article is not investment advice. Prices and fee structures change; check the terms with the provider before you buy.)
Frequently asked questions about the Bitcoin price prediction
Transparency note: This article was produced with the assistance of artificial intelligence and reviewed by our editorial team before publication. All figures and claims were checked against the primary sources linked in the text. The feature image was generated with AI.
Related articles
- Crypto Market Outlook After US Inflation Data: Bitcoin Eyes $125K as CPI Hits 2.7%
- Crypto Market Crash News As BTC Price Crash Back To 56K
- Bitcoin Price Prediction: What to Check on Levels, Holding Period and Leverage Before the October 28 Rate Decision
- Bitcoin Surges Past $112,000 as the Fed Opens Doors to Crypto: What’s Next?
- 3 Reasons Why Bitcoin Price Can Reach $150,000 Before 2026
Which topics should we dive deeper into?
Select what genuinely interests you. Your picks feed directly into our editorial planning.
Crypto news that's actually worth your time.
Weekly. 60 seconds. Carefully curated by our editors: no hype, no promo flood, no spam.

March 4, 2025 9:17 PM

Bitcoin Price Prediction ahead of the Upcoming White House Crypto Summit
With the remarkable Bitcoin volatility, and after briefly surging earlier this week before dropping again. Is a Bitcoin price surge expected ahead of or after the upcoming White House Crypto Summit?
June 13, 2024 4:13 PM

Crypto Market DOWN As Bitcoin Price Slides, Ethereum Price Consolidates, And XRP Price Nears New Lows
The recent Federal Reserve decisions and market dynamics impact Bitcoin, Ethereum, and XRP. How to manage and what to monitor amid market volatility and uncertainty?
September 6, 2026 11:19 AM

Bitcoin Price Today: BTC Holds Firm Before The Biggest Week Of The Month
Bitcoin sits near $80,000 after a jobs report killed a four-month high. CPI, the Fed and a Senate vote all land in the next ten days.
October 23, 2025 12:26 PM

Bitcoin Awaits FOMC Decision as Gold Cools Off: Will Crypto See an Inflow of Capital?
Bitcoin trades around $109K ahead of next week’s FOMC meeting. With gold slipping, will capital rotation favor crypto as markets brace for new Fed moves?
October 26, 2026 7:36 AM

Bitcoin Price Crash: Top 3 Reasons Why BTC Price Dropped Below $80,000
Bitcoin price crashed below $80,000 over the weekend. Oil, ETF outflows and a wave of liquidations explain the move, and the Fed decides this week.
July 25, 2026 11:27 AM
Crypto Price Today: Market Slides Again as Bitcoin Fails at $67,000
Bitcoin slipped back under $64,000 after tapping $66,990. Oil, ETF outflows and Fed nerves are dragging the whole crypto market lower.

October 24, 2026 3:28 PM

Bitcoin Price Prediction: Fed on Wednesday, $11.1 Billion Expiry on Friday, Which Date Moves the Price?
Analysis: the Fed decides on October 28, and two days later more than $11.1 billion in bitcoin options expire. The market has moved the rate rise to December, and that shifts the levels for this week.
December 12, 2024 11:28 AM

Bitcoin Hits $100K Again – But a Crash to $60K Might Be Next
Bitcoin is back at $100K after dropping to $94K, but concerns are growing as BTC faces strong resistance at $104K. Will the bullrun continue, or is a major crash coming in January?
October 12, 2026 7:53 PM

Bitcoin Forecast: Last Inflation Print Before the Fed, and $82,500 Is the Level That Decides
Bitcoin trades at $82,663 on Monday evening, below its 20-day line but above its 50-day line. Wednesday brings the last US inflation print before the Fed decision of October 28, and it sets the range for the next two weeks.
August 21, 2025 4:58 PM

Bitcoin Price About To CRASH as Fed Pushes Back on September Rate Cut
A Fed official dismissed the case for a September rate cut, sending shockwaves through markets. With Bitcoin showing a familiar topping pattern, is a crash next?
May 17, 2026 5:14 PM
Bitcoin Price Prediction: Fed Liquidity Turns Bullish as BTC Holds Near $78K
Bitcoin holds near $78K as Fed liquidity signals improve. Could rising liquidity support the next BTC recovery?
March 15, 2025 5:40 PM

Bitcoin Price Prediction March 2025 with FOMC and TRUMP in Play
Bitcoin price prediction for March 2025 is one to expect, ahead of the upcoming FOMC meeting and Trump's strategic crypto reserve. What to expect for BTC price?
September 3, 2024 10:19 AM

How Important Is The $70k Level For BTC Price Bullish Momentum?
Bitcoin's $70k level is highly important to keep its bullish momentum, but will BTC Price keep its uptrend this September?
September 1, 2024 1:30 PM

Bitcoin Price Prediction: How Will September Unfold For BTC Price?
Bitcoin price is facing significant market volatility, as it hovers around $58,000. What are the key indicators and on-chain data shaping the future of BTC Price, and how will September unfold?
July 11, 2026 2:16 PM

Bitcoin Price Prediction: Can BTC Reach $70,000 After the CPI Test?
Bitcoin is grinding higher into a make-or-break week. One level is capping the rebound, one macro event could decide the next move — here's what the chart says.
September 14, 2024 12:01 PM
Bitcoin Surges Past $60K: The Start of a Major Rally or Just Another Bull Trap?
Bitcoin has surged past $60,000, sparking optimism among investors. But with looming market volatility and whale activity, is this the start of a new rally or just another bull trap?
October 26, 2026 6:30 AM

Bitcoin at $79,978: what to watch at the lowest level since September
Analysis: Bitcoin slipped to $79,332 overnight into Monday, its lowest level since September 18. Wednesday's Fed decision, Thursday's mining adjustment and the German one-year holding period will decide what the setback means for you.
October 25, 2026 9:44 PM

XRP price prediction: a 1.54 percent day and the level that decides
Analysis: XRP stands at $1.30 on Sunday evening and covered just 1.54 percent between high and low on the day, a third of the range of the past two weeks. The Fed decides on rates on Wednesday, and the tightness in the chart is why that date carries more weight for XRP than the day's price move.
June 24, 2024 10:37 AM

Bitcoin Price Prediction: Can BTC Price Fall Below 50K?
The profitability of Bitcoin futures cash-and-carry trades has plummeted amid a significant crypto market selloff. What are the reasons behind the decline and what can traders expect next?
August 24, 2024 5:58 PM

Bitcoin Price Prediction: BTC Surges 4% to Break $62K, Targets $66K Next
BTC jumps 4% in the past 24 hours, breaking through the $62,000 resistance. With the entire crypto market following suit, can Bitcoin maintain its bullish momentum?
February 20, 2025 2:00 PM

Bitcoin Price Prediction: Is BTC Ready to Break $100K Again?
Bitcoin's price is showing signs of a strong rebound, hinting at a potential breakout past $100,000. With the entire crypto market inching higher, traders are eyeing key resistance levels for the next big move.
June 9, 2025 4:11 PM

Can Bitcoin Hit $111K This Week & What’s Next in the Trump–Musk Feud
Bitcoin is holding strong above $107K, sparking hopes for a retest of its $111K all-time high this week. Meanwhile, tensions between Elon Musk and Donald Trump appear to be cooling—here’s what that could mean for the market.
April 18, 2025 1:05 PM

Massive BTC & ETH Options Expiry Today – What It Means for the Market
Over $2.25 billion in Bitcoin and Ethereum options are expiring today, sending ripples across the crypto market. With traders eyeing the “max pain” levels, could we see sudden price swings in BTC and ETH?
September 21, 2026 10:40 AM

Bitcoin Price Explodes Past $84,000: Here Is What Is Driving BTC
Bitcoin just ripped through months of resistance in a single session. Here are the real reasons behind the BTC rally and the level that matters next.
January 31, 2026 11:18 AM

Bitcoin Price Prediction: Key Levels To Watch After the Historic Gold Crash
Bitcoin price faces high volatility following a massive gold crash. We analyze BTC support levels and retracement targets for the 2026 market cycle.


More from CryptoTicker