
Bitcoin Rainbow Chart: the middle of the colour bands sits at $140,000, the price at $82,000
The Bitcoin Rainbow Chart places the price in nine colour bands around a logarithmic regression. What the bands show today, where the model comes from and the point at which it has been wrong for years.





Which topics should we dive deeper into?
Select what genuinely interests you. Your picks feed directly into our editorial planning.
Crypto news that's actually worth your time.
Weekly. 60 seconds. Carefully curated by our editors: no hype, no promo flood, no spam.
The Bitcoin Rainbow Chart is not a price target but a frame of reference: it lays nine coloured bands over the price history and shows whether the current price sits high or low against the long-term growth path. Recalculating the regression across every daily close since 2010, the centre line of the arc runs at roughly $140,300 on this October 15, 2026. The bitcoin price itself stands at $81,600 to $82,200. Bitcoin is therefore trading well below the middle of its own historical trend, in the green zone of the arc.
That is exactly the appeal of this presentation, and at the same time its danger. The arc turns a volatile price into a tidy graphic with clear colours. That the colours themselves rest on an assumption which shifts with every cycle is not something the picture reveals.
What the Bitcoin Rainbow Chart shows: nine bands around a logarithmic regression
A logarithmic regression is a fitted curve drawn through a cloud of points whose increments shrink over time. For bitcoin that means the price grew by multiples at first and by percentages later. Plot the price on a logarithmic axis, where each step upwards means a tenfold increase, and the steep climb of the early years becomes an almost straight line.
That line is the middle of the arc. Around it the model places bands at fixed distances, above and below. The common presentation works with nine bands, from a deep blue zone at the very bottom to a red zone at the very top. Each band stands for a fixed distance from the middle, measured in powers of ten. A distance of 0.2 powers of ten corresponds to a factor of 1.58, a distance of 0.6 powers of ten to a factor of 4.
In the best-known version the colours carry mocking names, from the sell-off at the bottom to maximum bubble territory at the top. The operator of the site writes himself that there is no scientific basis for it and that you cannot predict the price with a rainbow. That line does not sit in the small print but directly beneath the graphic.
The formula behind the arc: why the centre line grows with the logarithm of the days
The calculation behind it fits on one line. The centre line follows from the number of days since the blockchain started in January 2009. The base-ten logarithm of the price grows linearly with the natural logarithm of the elapsed days. In the original 2014 version it reads: price equals 10 to the power of 2.9065 times the natural logarithm of the days, minus 19.493.
The two numbers 2.9065 and 19.493 are no natural constants. Both come from a fitting exercise on the price data available in 2014. Repeat the same calculation with more data and you get different numbers. Recalculated across all 5,903 daily closes from August 18, 2010 to October 15, 2026, the coefficient is 2.4318 and the subtracted term 16.2007.
The difference sounds small and is enormous. With the 2014 numbers, the centre line would sit at around $1.14 million today. With the numbers from the complete price history it sits at $140,300. The same model, the same form of equation, a difference of a factor of eight. The centre line is therefore no property of bitcoin but a property of the period it is calculated from.
Where the price sits today: 0.24 powers of ten below the centre line
For October 15, 2026, the calculation across the full price history gives a centre line at $140,295. The daily close stood at $81,567, with afternoon trading at around $82,200. The distance is therefore 0.24 powers of ten to the downside, or in familiar terms: bitcoin costs 58 percent of what the fitted curve shows for this day.
The distance to the all-time high helps place that. It stands at $124,777 and dates from October 7, 2025, the week of a good year ago. From the high to today the price has given up around 35 percent, while the centre line has kept rising over the same year. Together, both push the price down within the arc without anything having changed about bitcoin itself.
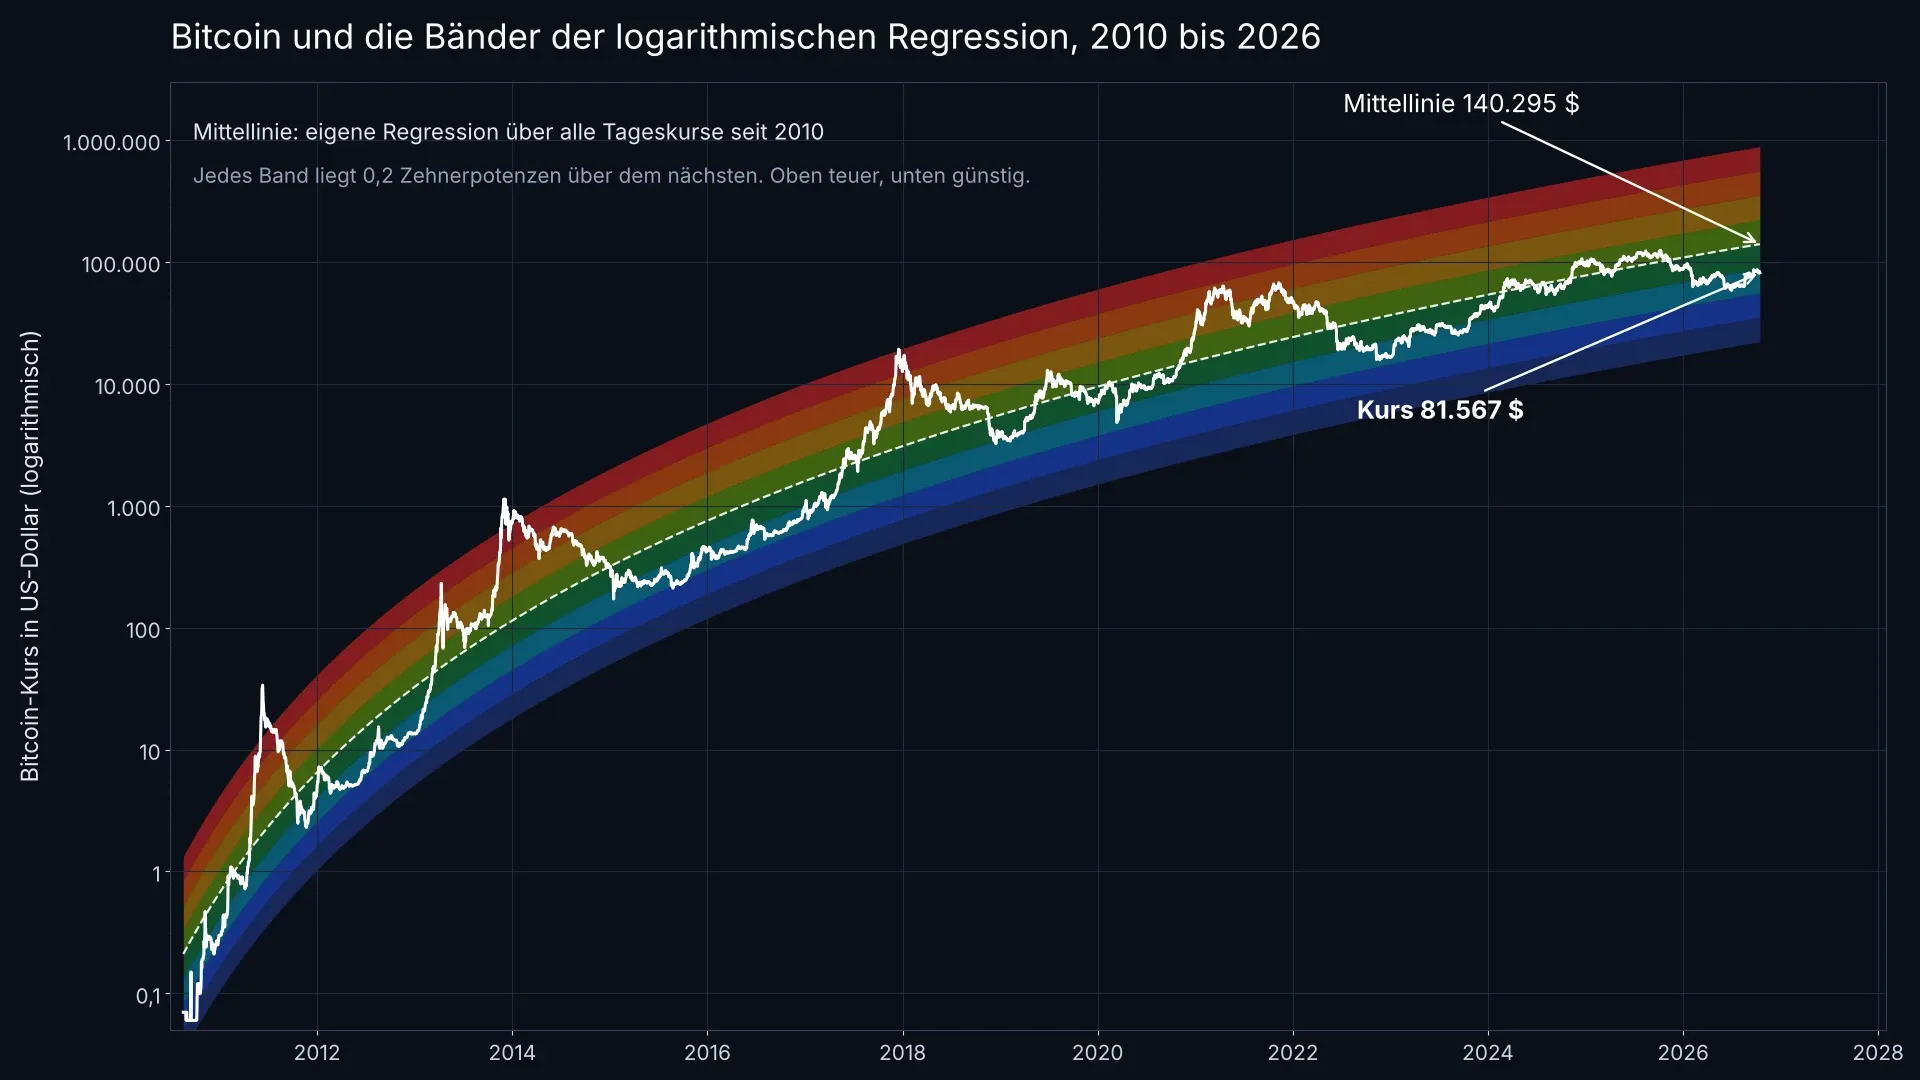
The nine bands in dollars: from 35,240 to 885,200 for October 15, 2026
Because the centre line rises every day, the band boundaries move with it. For today they sit, calculated from the same fitted curve, at these values:
- $35,240 and below: the lowest zone, the sell-off in the familiar version
- $35,240 to $55,852: deep blue zone, historically the floor of severe bear markets
- $55,852 to $88,520: green zone, where the price stands today
- $88,520 to $140,295: light green zone below the middle
- $140,295 to $222,352: first zone above the centre line
- $222,352 to $352,405: yellow to orange zone
- $352,405 to $558,524: orange to red zone
- $558,524 to $885,200: red zone
- above $885,200: the maximum bubble territory of the presentation
These numbers apply to this one day. In a year the centre line sits around 9 percent higher on the arithmetic, in five years around 39 percent. The model therefore extends a path that rises more slowly than in the early days but never stops rising. That too is an assumption, not a measurement.
 Compare crypto analytics platforms
How often bitcoin stood in which band: 1,772 of 5,903 days in today's zone
A model is worth only as much as its hit rate. Count how many days the price spent in which band and a lopsided picture emerges. The zone where bitcoin stands today was by far the most frequent, with 1,772 of 5,903 days: 30 percent of the entire price history. Together with the two neighbouring bands around the middle, 75 percent of all days add up.
The spectacular edges, by contrast, are almost empty. Above the red zone, in maximum bubble territory, the price spent 100 days, or 1.7 percent of the time. Below the deepest blue band it was 36 days, or 0.6 percent. Waiting for those edges means waiting a statistically very long time. Over the past seven years the lower edge has not been reached once.
A sober finding follows. The colour scale promises a decision aid but fails to deliver one precisely when it would be needed. For 75 percent of the time the price stands in the broad middle, and there the colour says nothing a glance at the price chart would not show as well.
Where the model comes from: a 2014 joke and a regression from the Bitcointalk forum
The rainbow and the calculation have different fathers. The coloured arc over the price history appeared in August 2014 as a post in a Reddit forum and was, according to several retrospectives, half ironic: a jab at the scene's habit of seeing a law of nature in every price chart.
The calculation beneath it came the same year from another corner. On October 22, 2014, a user opened the thread "Logarithmic (non-linear) regression - Bitcoin estimated value" in the Bitcointalk forum and presented the formula there along with a chart. In his own post, the author writes that the whole thing is "just a model, not a crystal ball".
The two parts were brought together later on the Blockchaincenter site, which maintains the chart to this day. Its operator reworked the formula in November 2022, after the price broke through the lower boundary of the old version on its fall below $16,000. The current version continuously fits the regression to the entire price history.

Where the model goes wrong: the centre line falls with every cycle
The heaviest objection to the Rainbow Chart can be worked out on paper. Fit the same curve through the price data only up to a given cut-off date and it becomes clear how strongly the result depends on the period chosen. For today, the calculation says:
- With data only to the end of 2014: centre line today at $1,140,722
- With data only to the end of 2017: centre line today at $141,720
- With data only to the end of 2021: centre line today at $193,892
- With data only to the end of 2024: centre line today at $150,388
- With all data to today: centre line at $140,295
The 2014 version is off by a factor of eight, because it was extended twelve years into the future. That alone would be no reproach. What stands out is the direction: every extension of the data window pushes the curve down. The model therefore always corrects itself the same way, and only once the price has forced it to.
In practice that means a band showing "cheap" today can show "expensive" in two years after the next adjustment of the same formula, without the price having moved. A statement that changes retrospectively is no basis for a purchase decision.
 Find a Bitcoin savings plan with fees that fit
The cycle highs are moving down: from 1.04 to 0.47 powers of ten above the middle
The same development shows in the three big price peaks. Measured against today's fitted curve, the high of November 30, 2013 stood at $1,134 and therefore 1.04 powers of ten above the centre line, or eleven times it. The high of December 16, 2017 reached $17,508 and 0.77 powers of ten; the high of November 9, 2021 stood at $67,562 and only 0.47 powers of ten above the middle.
The lows move along too, but less strongly: the floor of December 15, 2018 sat 0.22 powers of ten below the centre line, that of November 21, 2022 at 0.33. The price therefore swings in an ever narrower corridor around its trend. For a model with nine equally wide bands that is a problem: the outer bands lose their function because the price no longer reaches them. October 7, 2025 at $124,777 was the most recent cycle high, and that too stayed within the middle bands.
To place the market breadth behind this, metrics with the same ambition but a shorter horizon are in our look at the 200-day line and the hashprice. The halving rhythm underlying many of these cycle comparisons is shown in our halving overview.
Rainbow Chart against stock-to-flow: two models, one design flaw
The Rainbow Chart has a well-known relative. The stock-to-flow model derived the bitcoin price from the ratio of existing supply to annual new production and was considered strikingly accurate around 2020. It predicted six-figure prices for the years after the 2020 halving and was, measured against the actual course of 2022 and 2023, far off.
Both models share the same design flaw: a curve that fits the data so far already counts, for them, as a property of the market. The longer the series grows, the worse the original curve fits, and the more often it has to be readjusted. A model that adapts to every new data point describes the past ever better and the future not one day further.
Both are therefore usable as a reading aid and useless as a signal generator. Comparing valuation models properly takes raw data rather than colourful pictures. An overview of the tools for that is in our comparison of crypto analytics platforms.
What the Rainbow Chart is worth for investors in Europe: a frame, not a buy signal
For investors the chart remains an orientation picture with tight limits. Three points count in practice. First, the colour is a statement about the distance to the price's own trend, not about the business behind it, the regulation or the rate environment. Second, the scale changes retrospectively, which makes any buying rule built on it unreliable. Third, it says nothing about timing: the price can spend years in one band.
In tax terms the chart changes nothing in any case. For private disposals of cryptocurrencies, the one-year holding period under Section 23 of the German Income Tax Act applies, and once it has run, a gain is tax-free. A sale that a colour suggests can destroy a running holding period and therefore cost more than the supposedly good entry level brings in.
If you still want something out of the model, use it as a cross-check on your own mood. When the price sits high in the arc and enthusiasm does too, the question of where the next buyer is to come from is worth asking. When it sits in the green zone as it does today amid general apathy, that is no buy signal, but it is an indication that the market is not trading expensively against its own history. For regular purchases over time, the cost-average effect is the more sober answer than any colour scale.
Rainbow Chart: $140,000 is a calculation, not a forecast
The centre line at $140,295 is the result of a fitting exercise across 5,903 daily closes, not the announcement of a future price. The distance of 58 percent to today's price describes the present and says nothing about the next month. Three steps follow from it:
- Check the data basis before trusting a colour. With any presentation, ask which period the regression comes from and when it was last adjusted. Tools that disclose raw data and the basis of calculation are in the comparison of analytics platforms.
- Decouple purchases from the model. A fixed amount at a fixed rhythm needs no colour reading and sidesteps the problem of a retrospectively shifted scale. Which providers allow that at what cost is shown by the comparison of bitcoin savings plans.
- Settle custody separately from the price. Whether the price sits in the green or the red band changes nothing about key risk. The devices for it are compared in our overview of hardware wallets.
The full interactive version of the model, including the operator's statement that the chart has no scientific basis, is on Blockchaincenter.
(As of October 15, 2026. This article is not investment advice. Prices and fee structures change; check the terms with the provider before you buy.)
Frequently asked questions about the Bitcoin Rainbow Chart
Transparency note: This article was produced with the assistance of artificial intelligence and reviewed by our editorial team before publication. All figures and claims were checked against the primary sources linked in the text. The feature image was generated with AI.
More on Bitcoin: All Bitcoin news at a glance
Related articles
- SpaceX Stock Up 40% in 5 Days: SPCX Adds $530 Billion as Musk Bets the Company on AI
- Stocks vs. Crypto: Where Should You Invest Right Now?
- How to Buy SpaceX Stock (SPCX): IPO Date, Valuation, and the 3 Best Platforms
- Bitcoin Price Volatility Is Moving BTC Price Down, But For How Long?
- Top 10 Altcoins to Buy in May 2026 as Bitcoin Recovers
Which topics should we dive deeper into?
Select what genuinely interests you. Your picks feed directly into our editorial planning.
Crypto news that's actually worth your time.
Weekly. 60 seconds. Carefully curated by our editors: no hype, no promo flood, no spam.

August 9, 2024 10:16 AM

Bitcoin Price Prediction: After Breaking The $60k Mark, Can BTC Price Surpass $70k Next?
A huge surge in Bitcoin price is on the horizon with multiple signals waving for investors to grab this opportunity. Explore the potential for BTC price...
June 24, 2024 8:16 PM

Bitcoin News Today: Bitcoin CRASH OVER or MORE Down To Go?
Bitcoin Price Crash below 60k, and the crypto market follows. Why this decline and how low can it go?
March 20, 2026 12:38 PM

3 Reasons Why Bitcoin Price Will Not Crash to $0
Bitcoin price will not crash to $0. Here are 3 key reasons why BTC remains supported by adoption, security, and long-term scarcity.
December 29, 2025 2:53 PM

Bitcoin Price Swings: Market Manipulation or Just How Trading Works?
Bitcoin’s sharp price swings spark manipulation claims, but traders see opportunity. Zooming out reveals how BTC volatility really works.
April 19, 2024 11:54 PM

Bitcoin Advocate Michael Saylor Sells MicroStrategy Stocks Amid Price Surge
What lies beneath Michael Saylor's stock sale amidst MicroStrategy's price surge and Bitcoin's upcoming halving event?
April 5, 2025 3:03 PM

Cardano Price Prediction 2025: Will BTC Integration Push ADA Price to $3 or $5?
Cardano price predictions for 2025 are heating up, with analysts pointing to a possible breakout between $3 and $5. And with the recent announcement by Charles Hoskinson, what to expect for ADA price?
November 18, 2024 7:00 AM

Bitcoin Price Prediction: Is The Journey to $100k OVER?
Bitcoin price is on the cusp of breaking $100k, driven by multiple factors. But as the BTC price falls back to $89k after reaching $93k, could it be the end of the journey to $100k?
June 19, 2025 9:15 AM

Bitcoin Price USD Outlook: Will $100K Hold or Is a Deeper Breakdown Coming?
The Bitcoin price (USD) is testing key support levels again. With a descending triangle forming and the $100K level in focus, traders are watching for the next big move. Is now the time to buy—or bail?
April 30, 2024 2:52 PM
What Bitcoin Strategy yields $400M in Profits?
A Bitcoin Strategy adopted by a major company's co-founder reported to have earned him $400M in profits: Fact or Fiction?
August 10, 2025 1:51 PM

Bitcoin Price Prediction: Can BTC Coin Break $120K After the Latest Rebound?
Bitcoin rebounds above $118K after a sharp dip. Can BTC finally break the $120K resistance and push toward new highs?
February 11, 2026 7:05 AM

5 Things to Look for BEFORE Buying Bitcoin
Thinking about entering the crypto market? Discover the 5 essential factors to check before you buy Bitcoin to secure your investment and strategy.
November 11, 2024 7:25 PM

Bitcoin Price Prediction: BTC Price of $86,000 REACHED! What Next?
Bitcoin has shattered its previous record, skyrocketing past $86,000 and reigniting a buying frenzy among crypto investors.
June 14, 2026 12:24 PM

Is Bitcoin Near a Bottom? BTC Enters Deep Bear-Market Valuation Zone
Bitcoin sits in a deep bear-market valuation zone with fear near record lows. Here's what on-chain data says about a bottom — and what could decide it.
June 16, 2026 11:16 AM

How to Buy SpaceX Stock (SPCX): Step-by-Step Trading Guide
SpaceX stock (SPCX) jumped to $192 on its second trading day. Here's the price action — and exactly how to trade SPCX step by step.
January 28, 2026 12:56 PM

Top 5 Altcoins to Buy in February 2026: Massive Discounts from ATH
With Bitcoin consolidating around 90K, discover the top 5 altcoins currently trading at a massive discount from their all-time highs for February 2026.

March 22, 2026 1:16 PM

Bitcoin Price Prediction: This Might Be the BEST TIME to Trade BTC for Profit...
Bitcoin price hovers near $69,000 as volatility returns. Here are the latest Bitcoin price predictions and professional strategies to profit from this market phase.
May 20, 2024 11:17 PM

Bitcoin Price Reaches 70K,Why Is Bitcoin (BTC) PRICE UP?
With BTC surpassing the $70K a while ago, a downtrend was kicked off. And everyone can't help but wonder, how low will it go? And what will the next adjustment price be for BTC?
June 24, 2026 7:05 PM

Bitcoin Crash: Will BTC Fall to $55K Next as Strategy Losses Deepen?
Bitcoin crashes below $60K as Strategy’s BTC losses deepen. Is $55K the next stop, or can the market recover?
April 15, 2026 12:00 PM

Bitcoin Price Corrects After $76,000 High: Is This a Consolidation or a Crash?
Bitcoin price faces a healthy correction after hitting $76,000. Learn how to trade consolidation phases and use support and resistance levels effectively.
July 6, 2025 1:30 PM

Bitcoin Price Prediction: Will $BTC Hold Above $107K or Break Down?
Bitcoin price Dollar shows signs of hesitation near $108K despite a strong bullish trendline. Meanwhile, whales are buying the dip - will you follow?
May 15, 2026 3:56 PM

Bitcoin Price Drops Below $80,000 as $700 Billion Wiped from US Stocks
Bitcoin plunges under $80,000 as US stock markets lose $700 billion at the open. Gold and silver see $1.5 trillion wiped in a massive global asset liquidation.
May 14, 2026 3:55 PM

US Stock Market Adds $11 Trillion in 45 Days: Is a Crypto Rotation Imminent?
The US stock market just added $11 trillion in value. Discover why this massive liquidity surge signals a bullish rotation for Bitcoin and altcoins.
March 30, 2026 6:35 PM

Tech Giants Lose $5 Trillion: Why Crypto Is Holding Steady (For Now)
The Magnificent 7 tech giants have wiped out $5 trillion in market value. While crypto prices remain stable today, historical trends suggest a potential shift.
November 5, 2025 1:16 PM

$1 Trillion Wiped: Risk-Off Storm Engulfs Stocks & Crypto
Global markets plunge as tech stocks and crypto crash, wiping over $1 trillion in value amid AI bubble fears and investor risk-off panic.
August 3, 2025 8:08 PM

Bitcoin Price Just Broke Support — But Is This Actually a Buy Opportunity?
Bitcoin broke its short-term support and dropped below key levels. But zoom out — BTC is still up big in 2025. Here’s why this could be a golden buying zone.


More from CryptoTicker