
SpaceX Stock (SPCX): From $211 Record to $104.83 Low in 5 Phases
SPCX trades 44% below its IPO week peak and 12% under the $135 offer price. The chart splits into five clear phases, and earnings land after the close.





Which topics should we dive deeper into?
Select what genuinely interests you. Your picks feed directly into our editorial planning.
Crypto news that's actually worth your time.
Weekly. 60 seconds. Carefully curated by our editors: no hype, no promo flood, no spam.
Seven weeks ago SpaceX pulled off the largest listing in stock market history. Today the stock trades below the price its own IPO investors paid, and the chart tells the story more clearly than any headline has.
$SPCX changed hands around $118.21 on Tuesday morning. That is roughly 44% below the closing record of $211 set on 16 June, about 12% under the $135 offer price, and it comes two sessions after the stock printed an all time low of $104.83. The company reports its first quarterly results as a public company after the closing bell tonight, and its first insider lockup tranche expires on Thursday.
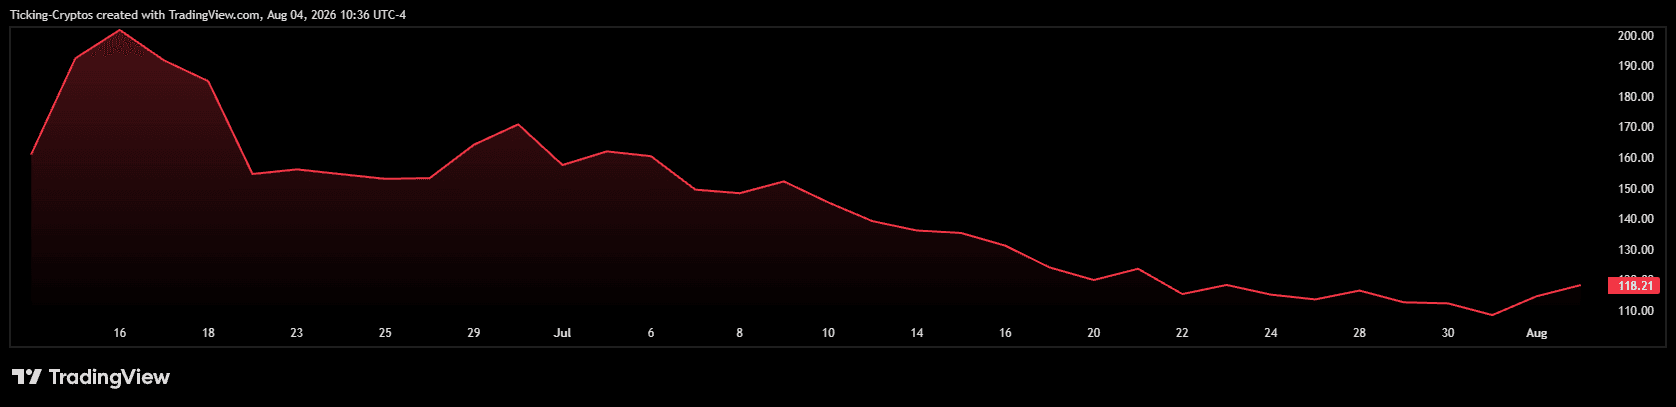
Two events, two days apart, on a stock that has spent seven weeks going one direction.
What actually happened at the IPO?
The deal itself was a success by every conventional measure.
SpaceX priced at $135 per share on 11 June and began trading on the Nasdaq on 12 June, raising $85.7 billion in total. The order book ran more than twice oversubscribed, with roughly $150 billion of demand chasing the raise, and around 30% of the allocation was reserved for retail investors, an unusually large share for a deal of this size. The retail tranche was exhausted before pricing closed, and many investors who applied through Robinhood, Fidelity, SoFi, Schwab, or E*TRADE received partial fills or nothing at all.
The stock opened at $150, closed its first day at $160.95, and by 16 June it had touched an intraday high of $225.64. At that point the market was valuing SpaceX near $2.1 trillion.
One detail from the deal explains much of what followed: SpaceX floated less than 5% of its outstanding shares. A very small float met very large demand, which is a reliable recipe for a high print, and an equally reliable recipe for what happens when that float expands.

How does the chart break down?
Looking at the chart from listing to now, the move splits into five distinct phases.
- Phase one, the launch pop (12 to 16 June). Price ran from the $161 first day close to just above the 200 line within four sessions. Almost 25% in a week, on scarcity rather than fundamentals, since there were no public results to trade on yet.
- Phase two, the first break (17 to 22 June). The chart drops from roughly $190 to about $155 across three sessions, then flattens. That is the point where the initial scarcity premium came out, and nothing in that stretch reads like normal profit taking. It is a gap down in the trend structure.
- Phase three, the index rally that failed (23 June to 7 July). Price built back to about $171 by 30 June into anticipation of Nasdaq-100 inclusion, which formally took effect on 7 July and forced an estimated $4.3 billion of price insensitive buying into the stock. The rally peaked before the event and faded through it. Textbook buy the rumour, sell the news. Anyone who bought the index story at $171 was down 10% within a week.
- Phase four, the grind (8 to 31 July). This is the section that matters technically. Twenty three sessions of lower highs and lower lows with almost no counter rally: $152, then $140, then $127, then $116, then $108.37 on 31 July. The IPO price broke on 15 July, when SPCX traded to an intraday low of $132.15. Trend moves this orderly are usually positioning, not panic.
- Phase five, the reversal (1 to 4 August). The stock hit $104.83 intraday on 3 August, then closed at $114.53, up 5.68% on the day, and has added another 3% since. That is the first higher low on the chart in seven weeks.
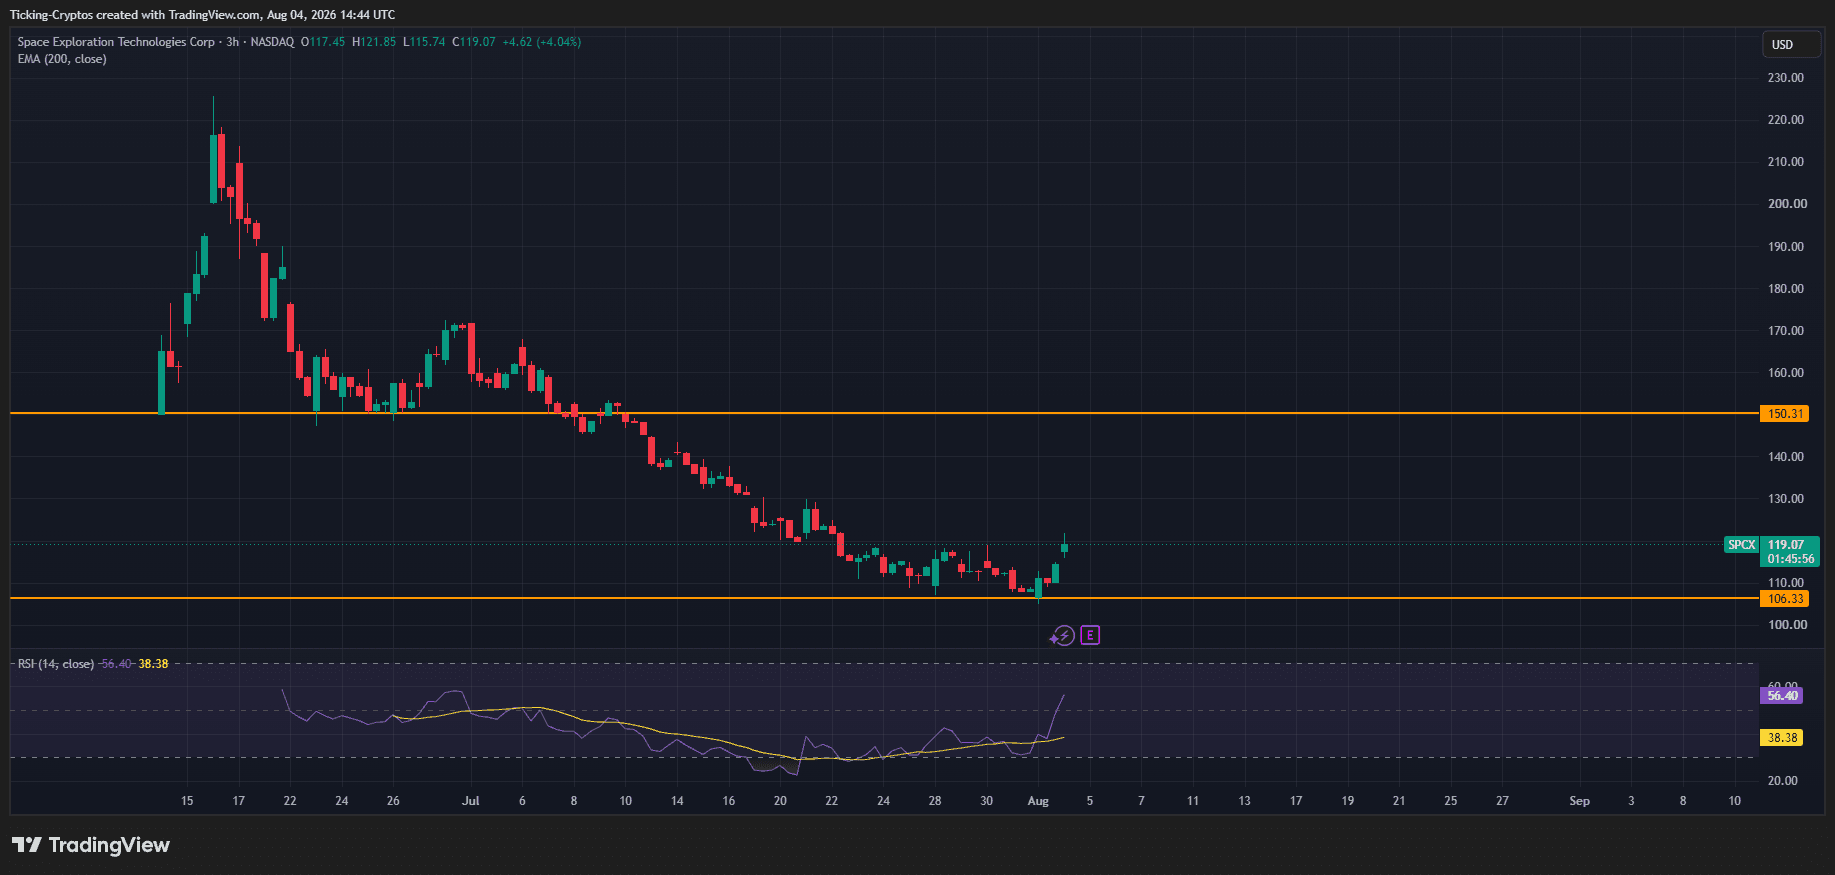
One reversal candle after a 50% drawdown is not a trend change. It is a stock that got oversold into two binary events.
Why did the stock fall so hard?
Four overlapping pressures, and only one of them is about the business.
- The float expansion. The first lockup tranche expires on 6 August, releasing roughly 911.5 million shares worth close to $123 billion at recent prices. That figure exceeds the entire current public float. It is also only the opening tranche of a staggered schedule: five smaller releases of around 7% each land at day 70, 90, 105, 120, and 135 after listing, with another 28% following Q3 results. Supply keeps arriving into December.
- The short trade. SPCX became the most shorted new listing on Wall Street, with short interest reaching roughly 28% of the float. S3 Partners attributed the build to the combination of price weakness and the approaching lockup, which is a positioning story rather than a fundamental thesis.
- The funding question. Morgan Stanley put SpaceX's capital requirement at $672 billion with no projected positive cash flow until 2035. The company lost about $4.9 billion in 2025 and roughly $4.3 billion in the first quarter of 2026 alone.
- The multiple. Even after the drawdown, SPCX trades near 49 times expected revenue. Tesla, for comparison, trades around 15 times. Morningstar's position is that the valuation implies investors wait decades for earnings to catch up to the price.
What does tonight's report need to show?
Consensus sits at roughly $6.8 to $6.9 billion in second quarter revenue and a loss of about $0.23 per share, though the range of analyst estimates runs from a $1.26 loss to a $0.33 profit. That spread tells you how little the market actually knows.
Three numbers carry the weight.
- Starlink. The connectivity unit generated $11.39 billion in 2025, about 61% of total revenue, and it was the only profitable segment with $4.42 billion of income. Subscribers passed 12 million in June, served by a constellation of more than 10,200 satellites. Second quarter Starlink revenue is projected near $3.83 billion. Morningstar expects subscriber growth to slow to 93% this year from 229% in 2025, so net additions and average revenue per user matter more than the headline. SpaceX raised prices in June and added a $10 monthly terminal fee, which should show up here.
- AI spending. The segment produced $818 million of revenue in the first quarter. After xAI rebranded to SpaceXAI on 7 July and the Cursor acquisition, the question is straightforward: is Starlink's cash flow funding an AI business that can grow into a $1.4 trillion valuation, or subsidising one that cannot?
- Starship cadence. Flight 13 deployed 20 Starlink V3 satellites in July. Investors want the timetable for regular operational launches, not another test schedule.

Where are the levels?
On the chart, the immediate resistance is $123, which is where the July slide accelerated. Above that, $150 is the next meaningful shelf, and it is also roughly where the trend broke in Phase two.
Below, $105 is now the reference low, with $100 as the round number that would likely attract attention if it goes. The $175.50 level is worth knowing for a different reason: if SPCX trades 30% above the IPO price on five of any ten sessions, another 10% of restricted shares release early. At $118, that trigger is nowhere close.
Analyst positioning is strikingly disconnected from price action. Twenty eight analysts cover the stock, 27 of them rate it a buy, and the average 12 month target is $236.71, with estimates spanning $62 to $800. Needham raised its target to $250 in mid-July, the same week the stock broke its IPO price. Phillip Securities initiated at Sell on 31 July. Ark Invest bought $16.6 million on the way down.
What is the realistic read here?
The setup is unusually clean, which is rare and worth saying plainly.
If earnings show Starlink margins expanding and management gives credible capital expenditure guidance, a 50% drawdown starts looking overdone, shorts covering 28% of the float adds fuel, and $123 then $150 come into play. If the numbers land soft or guidance is vague, Thursday's lockup stops being a scheduled event and becomes a supply problem into a market that has absorbed this stock badly since June.
The wider lesson has nothing to do with rockets. A sub-5% float produces a price that reflects scarcity, not consensus. Every holder who bought above $150 was buying a number the float was manufacturing. That mechanism is now unwinding on a schedule that runs through December, and no single earnings report changes it.
Frequently asked questions about the SpaceX stock
Transparency note: This article was produced with the assistance of artificial intelligence and reviewed by our editorial team before publication. All figures and claims were checked against the primary sources linked in the text.
Related articles
- How to Buy SpaceX Stock (SPCX): IPO Date, Valuation, and the 3 Best Platforms
- SpaceX Stock Up 40% in 5 Days: SPCX Adds $530 Billion as Musk Bets the Company on AI
- Will the SpaceX Stock Price Crash? What Comes Next After the Post-IPO Slide
- SpaceX (SPCX) Crashes 10% as Bond Spree and Lockup Fears Spook Investors — Here's Why
- SpaceX IPO Today: SPCX Stock Opens Near $152 and Jumps Toward $172 — What Happens Next?
Which topics should we dive deeper into?
Select what genuinely interests you. Your picks feed directly into our editorial planning.
Crypto news that's actually worth your time.
Weekly. 60 seconds. Carefully curated by our editors: no hype, no promo flood, no spam.

June 16, 2026 11:16 AM

How to Buy SpaceX Stock (SPCX): Step-by-Step Trading Guide
SpaceX stock (SPCX) jumped to $192 on its second trading day. Here's the price action — and exactly how to trade SPCX step by step.

June 13, 2026 10:33 AM
SpaceX IPO Recap: SPCX Closes +19% in a Record Debut, While Tokenized Stocks Stumble
SPCX jumped 19% to a $2T+ valuation on day one — but the tokenized SpaceX trade split in two, and the difference is the real lesson.
June 17, 2026 1:30 PM
SpaceX or Ethereum: Which Delivered the Better Return?
SpaceX stock versus Ethereum, one year on. We compare the returns, the dollar outcomes, and which is better positioned from here.
June 17, 2026 9:41 AM

SpaceX vs Bitcoin: Which Was the Better Investment?
SpaceX stock vs Bitcoin: who actually won? See what investing at SpaceX's launch versus buying Bitcoin a year ago would be worth today.
March 30, 2026 6:35 PM
Tech Giants Lose $5 Trillion: Why Crypto Is Holding Steady (For Now)
The Magnificent 7 tech giants have wiped out $5 trillion in market value. While crypto prices remain stable today, historical trends suggest a potential shift.

August 30, 2026 4:13 PM

SpaceX Lockup: What the Release Dates Through December 8 Mean for Tokenized SPCX Stock
The SpaceX lockup expires in five stages, the next on September 9, 2026. Anyone holding a tokenized SPCX share carries the full supply pressure and runs into a hole in the calendar on October 24.
November 5, 2025 1:16 PM

$1 Trillion Wiped: Risk-Off Storm Engulfs Stocks & Crypto
Global markets plunge as tech stocks and crypto crash, wiping over $1 trillion in value amid AI bubble fears and investor risk-off panic.
September 4, 2024 8:10 PM

Bitcoin Price Volatility Is Moving BTC Price Down, But For How Long?
As Bitcoin price faces market turbulence, the factors driving its recent volatility, from stock market impacts to key technical indicators signaling potential price shifts are highly important...
June 13, 2026 11:45 AM
Why Binance, Bybit and Bitget Got Zero SpaceX Shares: Kraken's xStocks Came Up Short
xStocks — Kraken's own tokenized-equity arm — couldn't source SpaceX shares, leaving Binance, Bybit, Bitget and MEXC with zero. Here's why.
April 30, 2024 2:52 PM

What Bitcoin Strategy yields $400M in Profits?
A Bitcoin Strategy adopted by a major company's co-founder reported to have earned him $400M in profits: Fact or Fiction?
May 14, 2026 3:55 PM
US Stock Market Adds $11 Trillion in 45 Days: Is a Crypto Rotation Imminent?
The US stock market just added $11 trillion in value. Discover why this massive liquidity surge signals a bullish rotation for Bitcoin and altcoins.
August 19, 2026 10:44 PM
Hyperliquid Price Explodes 22%: Here Is the Next Target
HYPE ripped from $57.96 to $72.16 in a single day. The chart shows one level standing between it and a new record.
August 9, 2024 10:16 AM

Bitcoin Price Prediction: After Breaking The $60k Mark, Can BTC Price Surpass $70k Next?
A huge surge in Bitcoin price is on the horizon with multiple signals waving for investors to grab this opportunity. Explore the potential for BTC price...
September 2, 2026 1:31 AM
Cerebras Lockup and Tokenized Stocks: The Release Schedule Through November 2026
On September 16, 2026 a further 14.6 million Cerebras shares become freely sellable, and the dates through November 9 are set out in the IPO prospectus. What the release schedule means for the tokenized wrappers CBRSB, CBRSX and CBRSON, and what it does not.
June 7, 2025 12:19 PM
Circle Stock Explodes After IPO: What’s Behind USDC's Wild Debut?
Circle, the company behind USDC, just made Wall Street history. After pricing its IPO at $31, the stock soared to over $100. But what’s driving the hype—and is it sustainable?
March 12, 2025 11:47 AM
XRP Price Prediction: Will It Hold $2 or Crash Further?
XRP is sitting on a critical $2 support level as the crypto market faces a massive crash. With Bitcoin tumbling and global economic tensions rising, can XRP hold, or is a deeper drop inevitable?
March 27, 2026 9:48 PM

$900 Billion Surge — But Markets May Be Pricing a Peace That Doesn’t Exist
$900B added to US stocks as Bitcoin surges and oil crashes after Trump’s Iran statement—but is the market pricing a false peace?
April 5, 2025 5:00 AM
XRP Price Prediction: XRP Rises Over 4% as Markets Crash Worldwide
While traditional markets bleed trillions and crypto stocks tumble, XRP is defying the trend. With a more than 4% price increase, XRP showcases resilience as global economic pressure intensifies.
March 24, 2026 4:06 PM
Circle (CRCL) Stock Plummets 17% on Stablecoin Yield Crackdown Fears
Circle Internet Group (CRCL) shares dropped 17% today following reports of a potential legislative crackdown on stablecoin yields. USDC remains pegged to $1 (for now).
July 7, 2024 3:21 PM
XRP, DOGE, and ADA Price Prediction: A Fast Recovery BUT How Long Lasting?
The potential turnaround for XRP, Dogecoin, and Cardano as key metrics indicates a buying opportunity amidst the current market downturn. Here is the latest XRP, DOGE, and ADA price prediction and analysis for a better understanding.

June 8, 2026 10:12 AM

Why Bitcoin Lagged the Nasdaq Since the US-Iran Conflict Began
Since the US-Iran war began, Bitcoin is down 3% while the Nasdaq rallied 20%, exposing a massive rift between crypto and equities.
March 16, 2026 4:13 PM

Trump Speech Today as Oil Drops and Stocks Surge — Will Bitcoin Be the Next Market Mover?
Oil falls and U.S. stocks surge ahead of President Trump’s speech on the Strait of Hormuz. Could Bitcoin become the next market mover?
October 19, 2025 3:53 PM
Gold, Bitcoin, or Stocks? Here’s What 2025 Performance Reveals
Gold leads 2025 with +62%, while Bitcoin, NASDAQ, and S&P lag behind. Here’s why diversification remains the key to surviving every market cycle.
December 30, 2024 7:00 PM
MicroStrategy is still buying Bitcoins despite the Bitcoin crash
MicroStrategy’s Bitcoin strategy continues to redefine corporate investment. Discover how their aggressive acquisitions and Nasdaq-100 inclusion impact Bitcoin prices, market trends, and industry dynamics.
July 23, 2024 11:43 AM
XRP Price Prediction: Why Is XRP Price Surge Highly Anticipated?
Why XRP might be the next big investment opportunity? Here are the insights from top analysts with indicators signaling XRP price and promising market trends.
October 15, 2023 2:21 PM

Bitcoin Price Prediction: Will Bitcoin Price GO UP SOON?
As cryptos consolidate, most slightly lost in valuation. In this Bitcoin price prediction, we analyze whether Bitcoin price will go up soon.
June 5, 2024 5:03 PM

Crypto Market Up: Bitcoin Breaches $71K, Altcoins Follow Suit, Eyes on New Highs
Cryptocurrencies are experiencing a surge, with Bitcoin leading the charge by surpassing $71,000. This bullish trend extends to altcoins, igniting optimism across the market. Will Bitcoin reach new highs?
More from CryptoTicker