
Solana forecast: $670 million in capital withdrawn and fees down four times as fast as trading: the level that decides
The capital locked on Solana has fallen by $670 million to $5.94 billion since October 5, and network fees dropped 15.2 percent. Trading, by contrast, gave up only 4 percent. What that divergence reveals about the next levels.





Which topics should we dive deeper into?
Select what genuinely interests you. Your picks feed directly into our editorial planning.
Crypto news that's actually worth your time.
Weekly. 60 seconds. Carefully curated by our editors: no hype, no promo flood, no spam.
Solana trades at $104.27 on Friday evening, 1.0 percent below the previous day. The figure alone explains little. What happens beneath the price is more interesting: the capital locked on the Solana blockchain has fallen by $670 million to $5.94 billion since the monthly high of October 5, while trading volume gave up only 4 percent. Network fees fell 15.2 percent over the same period, almost four times as fast as trading. Where the price can point on a horizon of months is set out in our Solana forecast.
This divergence is the real finding of the week, because it says something about who is still active on Solana and who has already pulled their money out. For investors in Europe, three concrete decisions hang on it: whether buying more fits this situation, whether staked SOL is sitting in the right place, and which levels justify entering at all.
Locked capital: $670 million less since October 5
Locked capital, known in the industry as total value locked or TVL, is the sum of all funds users have deposited into a blockchain's applications: into lending protocols, into trading platforms, into liquidity pools. The metric measures confidence with real money, because every dollar deposited carries a risk.
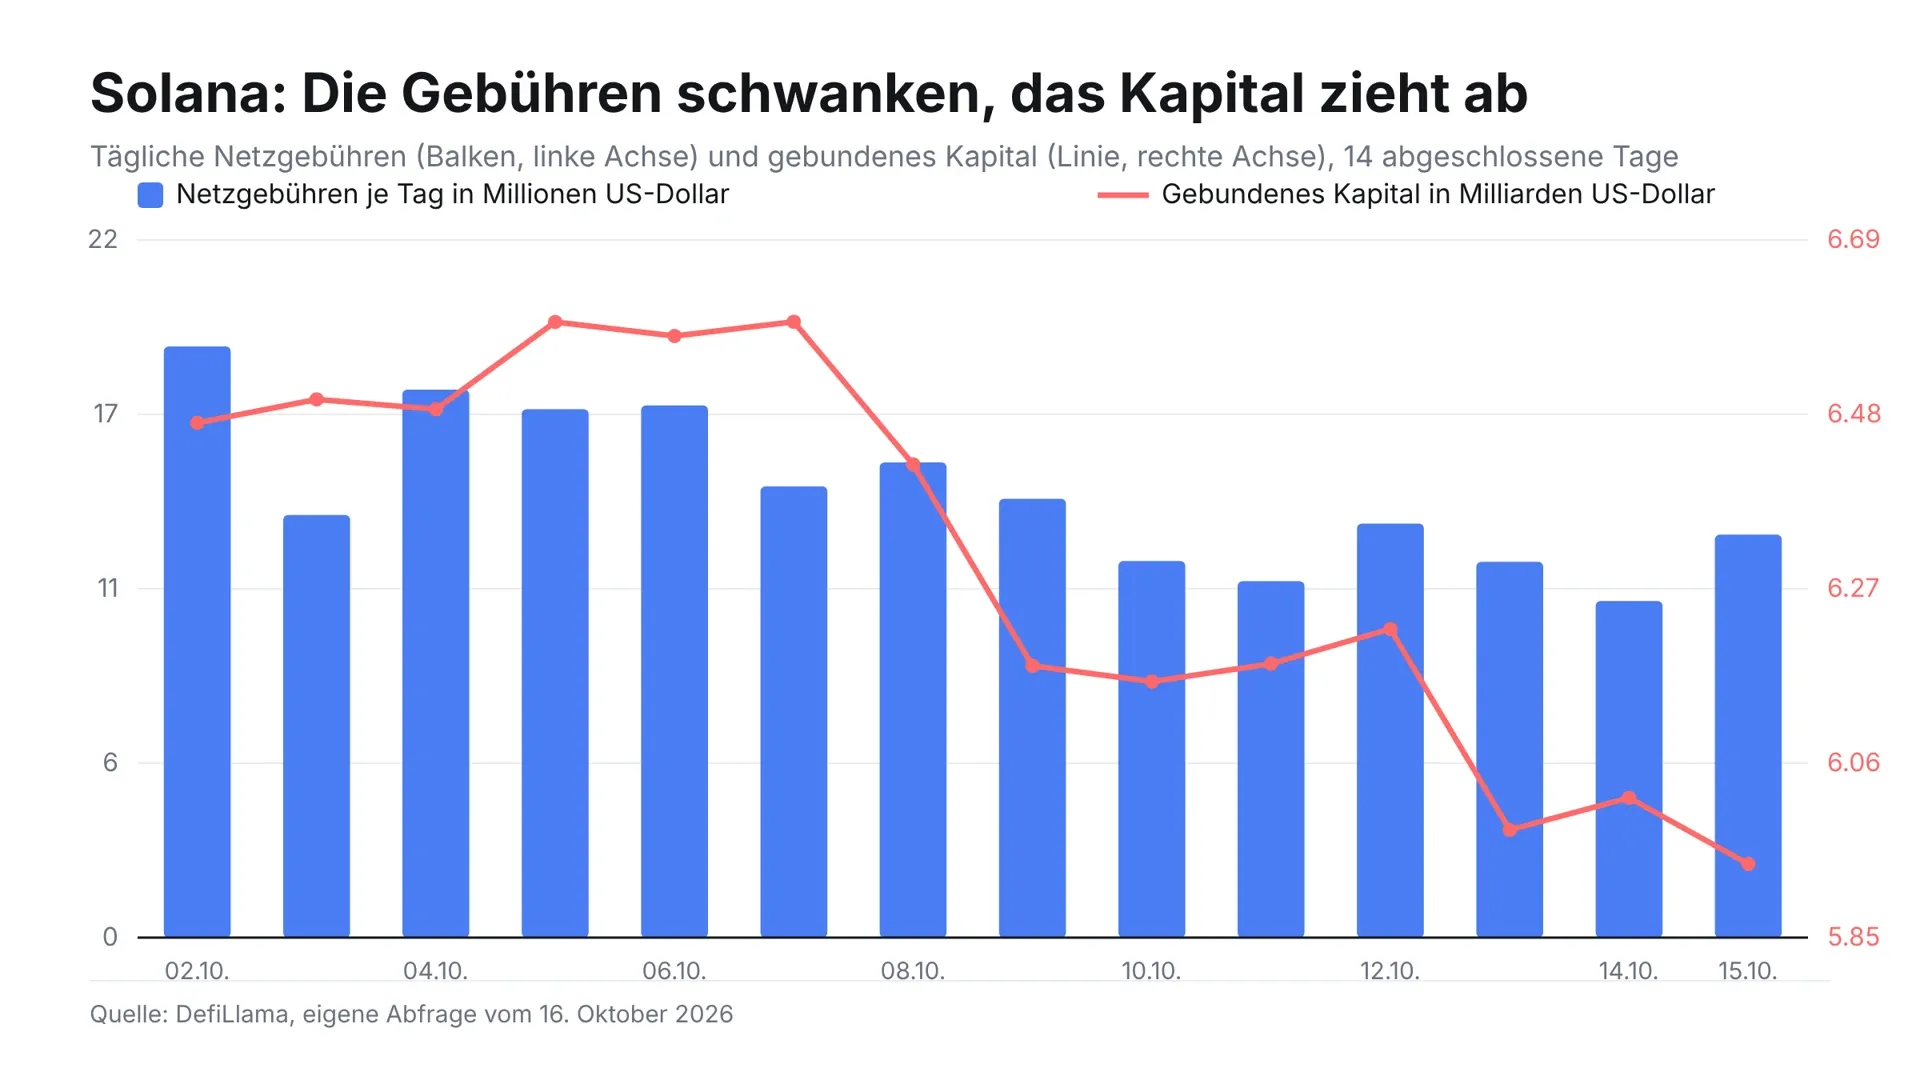
According to our query on DefiLlama dated October 16, 2026, that figure for Solana stood at $6.61 billion on October 5. By October 16 it was $5.94 billion. That is $670 million less, or 10.1 percent. Since Monday, October 12 alone, $284 million flowed out.
The outflow was not even. Up to October 7 the figure held above $6.57 billion. On October 8 and 9 it slumped to $6.18 billion, recovered slightly to $6.22 billion by October 12 and then slid again. Two downward steps, in other words, not a steady move.
Network fees: $85.68 million in seven days
The second figure comes from the same source. In the seven days to October 16, users paid $85.68 million in network fees, 15.2 percent less than in the previous week. Over 30 days the total comes to $462.25 million, down 8.26 percent against the previous month.
Trading volume on the blockchain's decentralised exchanges gave up only 4 percent over the same weekly window, to $13.68 billion. Over 30 days it was $71.84 billion, down 6.07 percent. Trading is therefore continuing on a large scale. It simply earns the network considerably less.
Why fees and volume can diverge
The mechanism behind it is well documented on Solana. The base fee per transaction is 5,000 lamports, a fraction of a cent, and it does not change. Most of the revenue comes from what are called priority fees: anyone who wants certainty that their transaction makes the next block voluntarily adds a little on top. Those surcharges rise when many participants compete for the same slot at once.
When fees fall faster than volume, it means trading is still happening but the urgency has gone. Competition for block space has eased. That pattern is typical when automated trading programs and arbitrage strategies scale back their activity while ordinary swaps carry on. A single day does not contradict the trend: on October 15, daily fees rose to $12.78 million, up 19.7 percent against October 14. At the start of the month, though, they were still above $19 million a day.
What has changed since October 12
In our Solana analysis of October 12, the 20-day line at $117 was the next target. That line stands at $113.99 today, so it has come down more than three dollars towards the price. It was still not reached: the price stood at $111.25 on October 12 and is now at $104.27, down 6.3 percent in four days.
The finding back then was a fee decline of 35 percent within seven days. That decline has not continued; it has settled at the lower level. What is new is the capital outflow, which was not this pronounced on October 12. The situation has shifted, then, rather than simply deteriorated.
 Find a licensed exchange for your SOL
The levels that count now
All the averages below are calculated from the daily closing prices of the past 90 days, data source CoinGecko, as of October 16, 2026.
To the downside
The next demonstrable level is the daily low at $103.65, 0.6 percent below the current price. Below that comes the 30-day low at $101.57. That level was last tested on October 9 and held, which makes it the more honest benchmark than the round $100.
If selling pressure reaches lower, the 90-day line sits at $96.20. The price is currently 7.7 percent above it. As long as it stays above that line, the advance since mid-July is intact in arithmetic terms, even though the short-term lines turned down some time ago.
To the upside
The first resistance is the 7-day line at $106.80, 2.4 percent above the price. Directly above it sits the daily high of $107.18. The two values are so close together that they read as a single zone.
The next real hurdle is the 50-day line at $109.36, then the 20-day line at $113.99. The 30-day high of $122.08 is 17.1 percent away and is not a realistic target this week.
The order of the lines says more than any single one of them: the 20-day line sits above the 50-day line, and both sit above the price. That stacking arises when a market comes out of a higher range and has not yet run its course.
Our assessment
From the newsroom's point of view, the capital outflow weighs more than the fee decline. Fees swing with the mood of the day, as the jump on October 15 shows. Locked capital moves more slowly, because a deliberate decision sits behind every withdrawal. $670 million in eleven days is therefore the more reliable signal.
Against that stands the order of magnitude: $5.94 billion is still more than most blockchains have ever locked, and trading volume is holding up remarkably well at minus 4 percent. The stablecoin base on Solana also stands at $15.72 billion according to the same DefiLlama query. That is purchasing power staying on the blockchain even when capital is pulled out of the applications. For comparison: on Ethereum it is $143.94 billion, on Tron $94.49 billion.
Our conclusion: the situation warrants caution on leveraged positions but no panic in an existing holding. Investors looking to build a position have a testable level in the 30-day low at $101.57 to anchor the decision to. This is explicitly not a buy or sell recommendation.

What European investors can take from it
Holding period and tax
In Germany, gains from selling crypto assets remain tax-free after a holding period of one year, governed by section 23 of the Income Tax Act. Below one year an exemption limit of 1,000 euros per calendar year applies. Exemption limit means: once it is exceeded, the entire gain is taxable, not only the portion above it.
Important for everyone who has put SOL to work in a protocol: lending crypto assets for a fee or committing them to liquidity calls for clean documentation of your own inflows. The tax authorities treat such income as other income. The current withdrawal of capital is a good occasion to put your own positions in order, entry dates included.
Staking
Staking SOL earns a share of precisely the fees that are currently falling, plus new issuance. If the fee side falls over a period of weeks, the actual yield drops even when the advertised figure stays the same. A look at the yield actually paid out over recent epochs is therefore worth more right now than usual. Providers' terms are set out in our comparison of staking platforms.
Then there is the unstaking delay: staked SOL is only freed at the end of the current epoch, which runs around two to three days. Anyone who might sell at short notice should factor in that wait before a level has been broken anyway.
Buying route and custody
Buying in the European Union has been governed by the MiCA regulation since the end of 2024. Providers need a licence, granted and supervised in Germany by BaFin. Which venues hold that licence and what they charge is set out in our comparison of crypto exchanges.
Larger holdings are best split between a trading balance and a long-term holding. The part that stays put belongs in separate custody whose access words are not stored digitally.
Leverage
Leveraged positions are especially vulnerable in a phase of falling liquidity, because less locked capital favours larger price jumps. Traders who still work with leverage calculate their liquidation price in advance and check the funding costs. Our comparison of perp DEXs gives an overview of the venues.
 Compare the staking yields for SOL
The next dates
On October 21, 2026, the Alpenglow network upgrade goes live in Epoch 1064. It markedly shortens the time to a transaction's final confirmation. For stakers the date matters because some validators have to update their software. Holders whose SOL sits with a provider can ask in advance whether its validators are prepared.
Regardless of that, the data remains the best leading indicator: if locked capital turns back up while fees follow, that is a sturdier sign than any single price candle.
Solana capital outflow: $101.57 decides, not the round $100
Three steps for the coming days:
- Set the level. The 30-day low at $101.57 is the testable point to the downside, the zone from $106.80 to $107.18 the first resistance to the upside. Buyers and sellers tie the decision to one of those levels instead of to a gut feeling. The terms offered by licensed venues are set out in our comparison of crypto exchanges.
- Recalculate the staking return. Compare the yield actually paid out in recent weeks with the advertised figure and check the unstaking delay before October 21. The providers at a glance: staking platforms compared.
- Document the holding period. Note the entry date for every position and keep the one-year deadline in view. Useful tools for that are in our comparison of tax software.
(As of October 16, 2026. This article is not investment advice. Prices and fee structures change; check the terms with the provider before you buy.)
Frequently asked questions about Solana
Transparency note: This article was produced with the assistance of artificial intelligence and reviewed by our editorial team before publication. All figures and claims were checked against the primary sources linked in the text. The feature image was generated with AI.
Related articles
- Solana Price Prediction: Will SOL Hit $400 or Face Further Correction?
- Solana (SOL) Price Prediction For June 2024
- Solana at a Three-Month High: What Is Holding the SOL Price Up as ETF Inflows Dry Up
- Solana price prediction: network fees down 35 percent in seven days, next target is $117
- Solana Regains Strength But Can It Push SOL Price Over $150
Which topics should we dive deeper into?
Select what genuinely interests you. Your picks feed directly into our editorial planning.
Crypto news that's actually worth your time.
Weekly. 60 seconds. Carefully curated by our editors: no hype, no promo flood, no spam.

July 2, 2024 5:13 PM

Solana Price Prediction And Analysis Following SOL Liquid Staking
Solana’s growing liquid staking is influencing SOL’s price. Solana price prediction and analysis following the staking is crucial, so here is what's next for SOL price...
July 26, 2024 2:26 PM
Solana Price Prediction: SOL Price Aims To 100% Surge
Solana (SOL) is poised for significant gains with expert analysis and bullish technical indicators. With the potential future movements, SOL price could surge by 100% in comparison with 2023.
July 22, 2024 10:10 AM

Solana Price Prediction: After Surpassing $180 Mark, When Is $200?
Solana (SOL) has surged past $180, aiming for further gains. Can SOL reach the $200 target?
June 20, 2026 11:51 AM

Solana (SOL) Price Prediction: Can SOL Reclaim $76 and Target $90 — or Is $60 Back in Play?
Solana trades near $71 after bouncing off $60. We analyze the SOL/USD chart, key support and resistance, and the targets that matter next.
September 18, 2026 4:41 PM
Solana Price Prediction: Why SOL Is Setting Up for $120
Solana just tagged $110 and the 200 EMA is rising. Here is what the SOL chart says about $120 and what has to hold first.

September 18, 2026 9:10 PM

Solana at a Seven-Month High: Why SOL Is Rising Twice as Fast as Bitcoin and What Stakers Should Check
Solana jumps more than 11 percent within 24 hours to $112, the highest level in seven months. Why SOL is leading the market, what the shorter slot time changes for stakers, and what you should check before buying or selling.
July 31, 2024 10:08 AM

SOL Price Prediction: Did Solana Rank Drop Back to 5 Due To The SEC Recent Update?
Solana's rank dropped back to 5th position despite last week's surge in market cap leading it to the 4th position. Did SEC's recent updates lead to this drop?
July 9, 2024 12:23 PM

Will SOL Price SURGE to $2000?
Top experts foresee a massive surge in Solana's price, predicting it could reach up to $2,000. Fact or Fiction, better to know first what's backing this Solana price prediction.

February 16, 2026 11:00 AM

Solana Price Prediction: Can SOL Reclaim $100 before March 2026?
Solana tests key support near $80. Discover if the Firedancer upgrade and $1.66B RWA growth can trigger a SOL price recovery in 2026.
October 4, 2026 1:31 PM

90 US banks now settle over Solana in 400 milliseconds: what it means for the SOL price
Since October 1, more than 90 banks and credit unions in North Dakota have been settling transfers with a stablecoin over Solana, provided by Fiserv, and a record in tokenised equity trading comes on top. What that means for the SOL price and which levels count.
March 23, 2026 10:41 AM
SOL Price Prediction: Key Levels to Watch in late March 2026
Solana (SOL) battles $90 resistance as institutional ETF inflows hit $1.45B. Explore key support levels and the impact of the Alpenglow upgrade on SOL price.
October 13, 2026 10:47 AM

Solana price at $108.21 as a $201 million buyback hangs on the $100 level: what to check now
SkyAI is selling Solana to buy back its own shares for up to $201 million, and ties the offer to a SOL price above $100. What the condition means for levels, order choice and tax.
September 30, 2026 1:13 PM

Solana Price Prediction: $188 Million Into the US Funds in One Week, What Matters Now
In the week of 21 to 25 September the seven US spot funds on Solana took in $188.21 million, while the price barely moved from $119.21. What this record inflow means for buying, staking and tax in Germany, and which network date is still open.
September 26, 2026 10:12 PM

Solana Price Above $120: What to Check on Staking Yield, Holding Period and Spread
Solana is trading at $121.00 on September 26, 2026, 8.6 percent above its level a week earlier. What a self-measured staking yield of 5.27 percent is worth, how the one-year holding period applies to staked SOL, and what an order in euros really costs.

June 18, 2026 10:57 PM
Is Solana (SOL) a Good Buy at Current Prices?
Solana has traded above its 200-day average since August and the 50-day average joined it on 21 September, but volume is no longer keeping pace. What chart structure, issuance and tokenisation say about buying at current prices.
September 20, 2024 10:51 AM
Token 2049 Boost Solana Pushing SOL Price Past $150, Can Solana hit $200 Next?
Solana price has soared following major announcements at Token2049, but can SOL hit $200 by October?
February 15, 2025 10:13 PM

ARKA Launch on Solana: How Prediction Markets and High-Profile Tokens Are Shaping SOL's Future in 2025
Solana's blockchain dominance continues in 2025 with the launch of ARKA, a prediction market platform. With these developments, experts predict the potential for SOL price to surge to $750.

December 26, 2023 6:44 AM

Solana Price Prediction for 2024: Will the SOL Price Rise to $2,000?
Will the SOL price rise to $2000 in 2024? Let's take a look at this Solana price prediction article in more detail.
September 27, 2026 7:14 PM

Solana Price at $121.93: What to Check on Staking Yield, Unstaking and Tax
SOL stands at $121.93 on September 27 at 16:42 UTC, after a 12.7 percent gain over seven days. More important than the weekly move is a calculation almost nobody makes: of the staking yield usually quoted, roughly a quarter is left in real terms, and the epoch decides when you can reach your coins again.
March 15, 2025 12:01 PM

Solana Price Prediction 2025: SOL Price Breakout to NEW ATH as Cup and Handle Pattern Shapes Up
Don't miss out on Solana's technical analysis as it forms bullish patterns and approaches key support and resistance levels, indicating potentially significant SOL price movements.
August 3, 2024 9:20 AM

Solana Price Crash: Why Is Solana Price Crashing Hard?
After the end of July meteoric rise of Solana price, closing in on $200, came August with a hard Solana price crash. So, why did SOL price crash so hard?
August 8, 2024 3:57 PM

Solana Major News: Solana Back To The 4th Rank Amid SOL ETF Approval
Solana and its memecoins are under the spotlight with SOL performance leading it to surpass BNB to the 4th rank as well as getting Solana ETF approval. What's more to expect?
March 24, 2025 6:00 AM

SOLANA May Be a Top Crypto Investment for April 2025, Here's WHY?
Solana is emerging as one of the top crypto investments. Here is a Solana price prediction and key levels to watch in April 2025.
November 17, 2024 3:29 PM

Solana Price Prediction: Will History Repeat Itself For SOL Price This November?
Within the current market explosion, Solana price remains in focus and speculations about whether can SOL reach a new ATH after 3 years?
January 24, 2025 1:30 PM

Solana Price Prediction After the New Trump Crypto Executive Order: SOL ETF NEXT?
Solana price is on the rise following the crypto executive order, fueling speculation about its potential to reach new highs. With all this positive momentum, could a SOL ETF approval come next?


More from CryptoTicker