
Back to the 2021 high: Shiba Inu would need a 50.77 billion dollar market value
Analysis: on October 27, 2021 Shiba Inu reached the highest level in its history at $0.00008616. Five years on SHIB stands at $0.00000488, and this assessment works out what market value a return to that level would demand today.





Which topics should we dive deeper into?
Select what genuinely interests you. Your picks feed directly into our editorial planning.
Crypto news that's actually worth your time.
Weekly. 60 seconds. Carefully curated by our editors: no hype, no promo flood, no spam.
The record shows: Shiba Inu trades at $0.00000488 on Tuesday evening, 94.34 percent below the all-time high of $0.00008616 that CoinGecko's data dates to October 27, 2021 at 19:54 UTC. Our reading follows below: the decisive figure for the coming months is not the price level but the market value that the old high would require at today's circulating supply.
This article works out that figure, sets the current moving averages beside it and shows what the futures market currently says about traders' expectations. Where the price can point over a horizon of months is tracked continuously in our Shiba Inu price prediction.
Five years after the all-time high of October 27, 2021
Shiba Inu's high has an exact date. On October 27, 2021 one SHIB cost $0.00008616. Five years have passed since, and the price stands at $0.00000488. That is a decline of 94.34 percent. Anyone who bought 1,000 euros' worth on the day of the high and has held since sees around 57 euros in the portfolio today.
The figure alone says little, because almost every meme coin from the 2021 cycle sits far below its high of the time. What is interesting is the direction of recent months: over a year SHIB lost 53.22 percent, over the past 30 days 17.73 percent, over the last week 4.84 percent. On Tuesday the price added 0.63 percent, after Monday's $0.00000485 marked the lowest daily average of October. We described that monthly trough on Tuesday in a separate piece on the September low; the price has since moved 0.62 percent away from that level.
Market value stands at 2.87 billion dollars, rank 38 in the overall market. Daily turnover across all tracked venues is 52.27 million dollars. In circulation are 589.24 trillion tokens out of a total of 589.50 trillion. Only 257.46 billion tokens, or 0.0437 percent of total supply, are therefore still outside the market. For the forecast that means no meaningful pressure is left from the supply side, because hardly any tokens remain that could be unlocked.
What a market value of 50.77 billion dollars would mean for SHIB
Here is the calculation that rarely appears in Shiba Inu price targets. A price target for a token with 589.24 trillion units in circulation is always also a statement about market value, and that can be checked.
Multiply today's circulating supply by the old high of $0.00008616 and the result is a market value of 50.77 billion dollars. The factor against today's 2.87 billion is therefore 17.7. For comparison: Solana stands at a market value of 59.67 billion dollars on Tuesday evening. Shiba Inu would therefore have to reach around 85 percent of today's Solana market value to trade at its October 2021 level again.
The difference from 2021 is the circulating supply itself. Back then a large share of the supply was not yet in the market, and the high formed on a considerably smaller base. Today the supply is practically fully distributed. Every dollar flowing into SHIB spreads across 589.24 trillion tokens instead of a fraction of that. A return to the old high is therefore arithmetically more expensive than the climb there was at the time.
The mechanism in brief: market value is price times circulating supply. If supply rises, the same price requires more capital. For tokens with trillions of units in circulation this relationship shifts sharply, and price targets derived from the chart routinely ignore it.
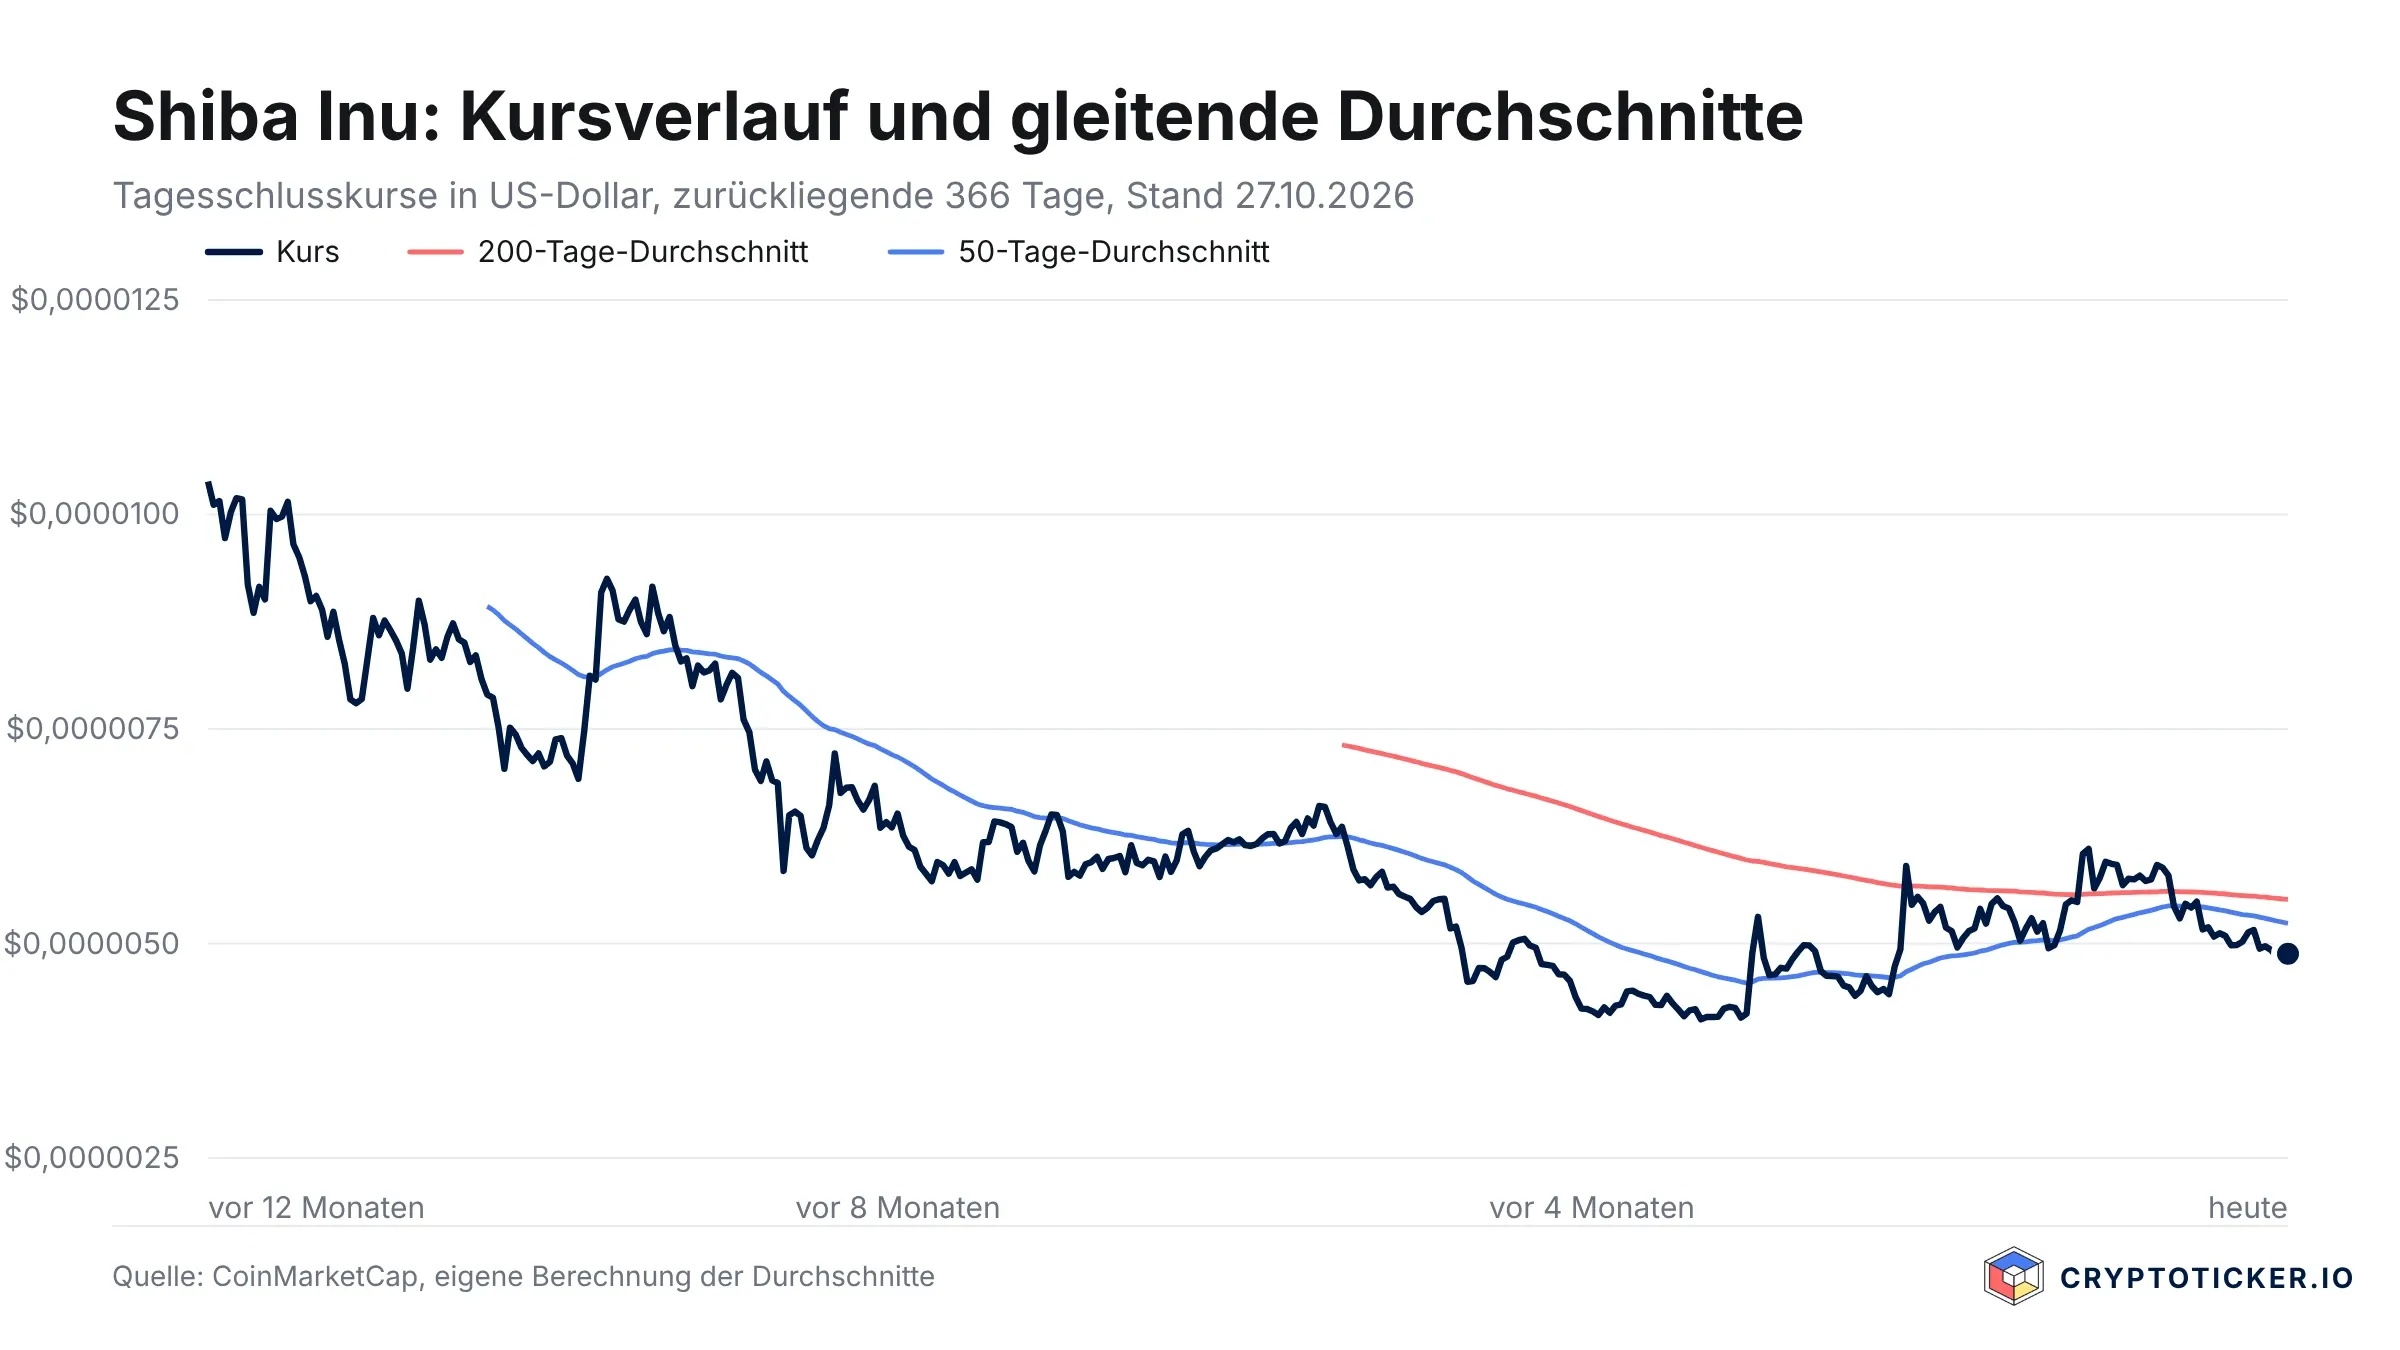
The levels: 50-day line at $0.00000523, yearly low at $0.00000411
Four values count for the coming weeks, and all four come from the daily closing prices of the past 366 days.
- 50-day moving average: $0.00000523. The price sits 6.81 percent below it. This line is the first hurdle on the way up.
- 200-day moving average: $0.00000551. Distance 11.54 percent. As long as the price stays below, the medium-term trend counts as pointing down.
- Yearly low: $0.00000411. The price has 18.52 percent of room down to it. That is the floor the market has seen in twelve months.
- Yearly high: $0.00001038. Distance 53.04 percent to the upside.
In October, trading spanned $0.00000592 on October 5 and $0.00000485 on October 26. The midpoint of that range is $0.00000538 and therefore close to the 50-day line. Both values coincide, which makes this area the actual decision zone. Since the start of the month SHIB has lost 15.15 percent, measured from the October 1 level of $0.00000575.
Why October's loss looks larger than it is
Two numbers for the same month diverge, and there is a simple reason. The decline since October 1 is 15.15 percent, the change over the past 30 days 17.73 percent. The difference arises because the 30-day window reaches back into September, where the price stood higher at $0.00000575. Anyone comparing monthly balances should watch the starting point.
 Find an exchange for your SHIB
The SHIB futures market is small, and that limits the leverage effect
Beside the spot market there is a second vantage point that often says more for a forecast: the futures market. There, investors trade perpetual contracts with leverage. The funding rate of these contracts shows which side is currently paying.
On the OKX exchange, the perpetual contract SHIB against USDT holds open positions worth 6.64 million dollars, as of October 27, 22:45 UTC. The funding rate is 0.00467 percent per eight-hour period. Annualised that is 5.12 percent paid by leveraged buyers to sellers.
What a funding rate is: perpetual contracts have no delivery date. To keep the contract price at the spot price, the dominant side pays the other every eight hours. A positive rate means more capital is betting on rising prices.
The level places the situation. 5.12 percent a year is a quiet reading. In overheated phases this rate reaches double-digit annual figures on meme coins. And open positions of 6.64 million dollars equal only 12.7 percent of daily spot turnover. For the coming weeks that means a large liquidation wave, the kind that moves a price by double-digit percentages within hours, currently has little material at this venue. The move has to come from the spot market.
Overall market sentiment stands at a fear and greed reading of 48 on Tuesday and therefore in neutral territory. The previous day it was 50. No signal pushing in either direction comes from there either.
Wednesday's rate decision and what it changes for meme coins
On Wednesday, October 28, the meeting of the US Federal Reserve's open market committee ends. The Federal Reserve publishes the calendar itself. For Shiba Inu this date matters indirectly, and the link runs through risk appetite: meme coins sit at the outer edge of the risk spectrum and react to rate signals more strongly than Bitcoin, because their price lives almost entirely on incoming capital rather than on earnings.
On Tuesday evening the large assets moved in a narrow range: Bitcoin stood at $80,761, up 1.11 percent; Ethereum at $2,346.77, up 1.65 percent; Solana at $101.14, up 0.96 percent; Dogecoin at $0.078538, up 1.73 percent. SHIB, at 0.63 percent, trailed all four. The pattern of the past week therefore holds: the meme coin joins recoveries more weakly than it joins declines.
Our assessment: what argues for a recovery and what against
From the newsroom's point of view, two documented points argue for stabilisation and two against.
In favour: first, 99.96 percent of supply is in the market, so no unlock of new tokens threatens to dilute the price. Second, the funding rate at 5.12 percent a year is low and the open position on OKX at 6.64 million dollars is small. There is no overheated leverage market from which prices crash.
Against: first, the price sits below both moving averages, 6.81 percent under the 50-day and 11.54 percent under the 200-day line. Technically that is not a floor but an ongoing downtrend. Second, the demand trigger is missing. Over the year SHIB lost 53.22 percent while Bitcoin stood at $80,761 on Tuesday; capital entering crypto in this environment is largely not going into meme coins.
What follows from that: the decision about the coming weeks falls in the area between $0.00000523 and $0.00000538. If the price closes above it for several days, the first hurdle is cleared and the 200-day line at $0.00000551 becomes the next target. If it falls below October's low of $0.00000485, the yearly low at $0.00000411 is the next documented level underneath. A return to the 2021 high presupposes a market value of 50.77 billion dollars, and the available data currently offers no indication of that. This is an assessment of the situation and not a recommendation to buy or sell.
 Track your holding period with the right tool
Holding period and loss offsetting: the tax view towards year-end
For investors in Germany this point becomes practical over the coming weeks. For tax purposes crypto counts as a private disposal transaction under section 23 of the German Income Tax Act. Sell within a year of buying and the gain is taxable; after a year has passed it is tax free. We track the current state of the political debate on that deadline on a dedicated page on the status of the crypto holding period.
The reverse applies just as much: losses from sales inside the one-year window can be offset against gains from other private disposal transactions in the same year. Anyone who bought SHIB this year and sits on a loss therefore has room to act while the calendar year runs. Once the one-year deadline passes, the loss can no longer be used for tax.
Three things are needed for that: the exact purchase date of every position, the purchase price and an allocation method if you bought more than once. The tax authorities accept position-by-position treatment for crypto assets; anyone working without records has to accept the less favourable approach in case of doubt.

Buying and storing Shiba Inu: what applies in Germany under MiCA
Since the European regulation on markets in crypto assets, MiCA for short, providers need authorisation to trade crypto assets with customers in the EU. For buying SHIB that means in practice: check whether the venue holds MiCA authorisation from an EU supervisor, which country granted it, and whether it accepts euro deposits by bank transfer. Fee models differ sharply, and on a token with eight decimal places a spread of a few percent registers immediately. Which venues hold the authorisation and what they cost is set out in the overview of authorised crypto exchanges.
On custody, the same logic applies to SHIB as to any other token on the Ethereum blockchain: leave it on the exchange and the exchange holds the keys. Self-custody requires an address on the Ethereum blockchain or on Shibarium, the project's own layer-2 blockchain. Transferring to your own address costs network fees, which on small amounts can reach the value of the position itself. Work that out beforehand.
What a perpetual contract means for retail investors
The leveraged products from the section above are not an option for most retail investors, and the reason is sober. At leverage of ten, a countermove of ten percent is enough to wipe out the stake entirely. SHIB moved between $0.00000485 and $0.00000592 in October, a range of 22 percent within one month. Swings like that regularly hit leveraged positions before the expected direction asserts itself.
Shiba Inu: recovery starts above $0.00000523
The situation comes down to three steps you can work through this week:
- Note the decision zone. Write down $0.00000523 as the 50-day line and $0.00000485 as October's low. Only a close above the first level turns the technical picture, and only a break of the second opens the way to the yearly low at $0.00000411. Where you trade at which fees is shown in the comparison of authorised crypto exchanges.
- Settle custody. Decide whether the position stays on the exchange or moves to your own address, and weigh the network fee against the position size. Which devices do the job and what they cost is set out in the hardware wallet comparison.
- Record the tax position. Note the purchase date and purchase price of every position before the calendar year ends, so that loss offsetting stays documented. Which programs track this automatically is shown in the overview of crypto tax tools and portfolio trackers.
Shiba Inu stands 94.34 percent below its high five years on, and a return there requires a market value of 50.77 billion dollars at today's circulating supply. The short-term question is smaller and more concrete: does the price hold above October's low, or not.
(As of October 27, 2026. This article is not investment advice. Prices and fee structures change; check the terms with the provider before you buy. Crypto assets are highly speculative, and a total loss of the capital deployed is possible.)
Frequently asked questions about Shiba Inu
Transparency note: This article was produced with the assistance of artificial intelligence and reviewed by our editorial team before publication. All figures and claims were checked against the primary sources linked in the text. The feature image was generated with AI.
Related articles
- 17 days above the 200-day line: what you can do now with Shiba Inu
- Meme Coins Defy Market Downturn: May 2025 Outlook and Q2 Forecast
- 21 million dollars in the SHIB futures market: the level that decides
- BONK Price Hits New ATH, Surpasses WIF and Marks Over 100% Surge
- Shiba Inu $1 Forecast: Evaluating the Chances of SHIB’s Remarkable Rise
Which topics should we dive deeper into?
Select what genuinely interests you. Your picks feed directly into our editorial planning.
Crypto news that's actually worth your time.
Weekly. 60 seconds. Carefully curated by our editors: no hype, no promo flood, no spam.

February 3, 2023 7:50 PM

Can Shiba Inu Reach $1? Our 2023 Prediction Checked in 2026
In February 2023 we asked whether Shiba Inu could reach $1. It could not, and it still cannot: at $0.00000583, SHIB would need a market cap of about $589 trillion. Here is what happened since.
January 17, 2026 1:35 PM
Shiba Inu Price Prediction: Will SHIB Delete a Zero in 2026?
SHIB trades near $0.0000059 in September 2026, down from $0.0000085 in January. What it would take to delete a zero before year-end, and what has changed since.

September 28, 2026 4:38 PM
Shiba Inu Price Prediction: What Matters Now That Shibarium Handles 1,680 Transactions a Day
Shiba Inu trades at $0.0000056 on September 28, 2026, and its own layer-2 chain Shibarium processes around 1,680 transactions a day after the reorg fix, against 4.69 million in August 2025. This piece sets out which figures actually carry a SHIB forecast today and what follows from them for buying, custody and tax in Germany.
September 24, 2023 8:56 PM

Shiba Inu Price Prediction: How High Can Shiba Inu reach Short-Term?
What's next for SHIB? Will its prices touch the much-anticipated $0.000010 mark? Let's analyze in this Shiba Inu price prediction.
September 20, 2026 7:15 PM

When Does the Shiba Inu Rocket Launch? We Did the Math on What Burning Really Achieves
For years the SHIB community has hoped that enough tokens would be burned to lift the price. We measured the past 30 days against the circulating supply. The result is sobering, but it finally explains why the rocket never launches.
December 20, 2024 3:25 PM

Solana Price Prediction: Will SOL Hit $400 or Face Further Correction?
Solana price prediction shows two possible paths: a bullish surge toward $400 or a bearish decline. Will Solana overcome its hurdles and reach new heights?

October 27, 2026 9:37 PM

Shiba Inu price at $0.00000488: lower than any day in September
Shiba Inu trades at $0.00000488 on Tuesday evening, below every daily level of September. What October has cost, which levels count now and what to check before a sale.
June 5, 2024 5:52 PM

Floki Inu (FLOKI) Skyrockets Like Pepe (PEPE): Will PlayDoge Follow?
Floki Inu reaches a new high, but is PlayDoge the next meme coin to explode? Here are the similarities, potential, and why experts are bullish on both and you decide!
May 28, 2024 4:10 PM
Dogwifhat (WIF) All-Time High: WIF 25% Surge In 2 Days
Dogwifhat (WIF), the leading meme coin on Solana, surged 25% in just two days, edging closer to its all-time high. Can it surpass top meme cryptocurrencies?
February 16, 2025 10:36 AM
XRP Price Forecast: SEC Shift, Key Resistance Levels, and New ATH Predictions
XRP price potential push to a new all-time high is in focus as the SEC's evolving crypto stance, key resistance levels, and bullish analyst forecasts suggest potential gains ahead.

January 4, 2024 8:00 AM

Shiba Inu (SHIB) Drops Below 0.00001 Amid Market Turbulence: What’s Next for SHIB?
Explore the latest on Shiba Inu: its price drop below $0.00001 in a $500M market crash and the lead developer's cryptic messages.

November 15, 2023 6:36 AM

Shiba Inu Price Prediction 2025: How High Will SHIB Price Go After the 2024 Halving
How high will the SHIB price go after the 2024 Halving? Let's take a look at this Shiba Inu Price Prediction 2025 article
October 30, 2022 2:59 PM

BIGGEST Shiba Inu Prediction: How High can SHiB reach before 2023?
What is a Shiba Inu prediction for the end of 2022? In this article, we deal with a possible Shiba Inu price increase for the next few weeks.
May 28, 2021 12:42 PM

Shiba Inu Price Prediction – is this Coin still Worth it?
Today, Shiba Inu's price is around its lowest since the pump. Is Shiba Inu crypto still worth buying? Should you Buy SHIB?
October 1, 2026 1:37 AM

Shiba Inu Forecast: 589 Trillion Tokens and What Matters Now for the Price Target
One cent per SHIB would equal 5.89 trillion dollars in market value, three and a half times Bitcoin. What the circulating supply says about realistic price targets, and which tax deadline is now running for investors in Germany.
August 23, 2023 7:29 PM

Shiba Inu Prediction Amidst Market Chaos: Is $0.0000050 the Next Stop?
Shiba Inu Price Prediction: Will SHIB descend to $0.0000050 and erase all previous gains? Will Shiba Inu crash further?
October 5, 2026 4:26 PM

Shiba Inu price up 4.4 percent: outperforms the market, but 88 trillion SHIB sit on exchanges
Shiba Inu adds 4.4 percent on Monday, making it the strongest of the six big names. At the same time 88.08 trillion SHIB worth $525 million sit on trading venues, almost five times a single day of turnover.
September 18, 2024 7:57 PM

FACT: Will Shiba Inu Coin reach $1 during the next Bullrun?
Will Shiba Inu coin reach $1 during the next bullrun? Let's analyze in this Shiba Inu coin price prediction.
June 4, 2024 2:41 PM

Top 3 Ethereum Meme Coins to Buy in June
Have you missed out on the PEPE coin surge? Here is your second chance with other meme coins. Check these top 3 Ethereum meme coins to invest in this June and capitalize on the latest crypto market trends!
March 3, 2024 12:02 PM

Shiba Inu ‘s 128% Surge: Future of SHIB?
Discover how Shiba Inu soared beyond expectations, outpacing rivals and market trends. What's next for this crypto underdog?
October 26, 2023 3:28 PM

Shiba Inu News: Is a Big Jump to 10 Cents Coming?
Discover why Shiba Inu (SHIB) is making headlines with its recent trading volume surge. Is the meme coin on its way to reaching 10 cents? Read our insightful analysis on SHIB's market trends and investor interest.
November 29, 2022 9:40 AM

Shiba Inu Price Prediction – How Far Will the SHIB Go?
What is the Shiba Inu price prediction for the end of 2022 after consolidation? Let's take a look at it in more detail.
June 16, 2022 8:07 AM

Shiba Inu Price Prediction – Is SHIB dead?
Is SHIB dead? In this Shiba Inu price prediction, we’re going to technically study the SHIB token. Let's take a look.
September 17, 2021 1:20 PM

Is SHIBA INU even Alive? SHIB jumped 35% in the past 24 hours!
The price of Shiba Inu soared by more than 30%. Can people still invest in this project? Should you buy Shiba Inu and still expect profits?
June 29, 2024 4:49 PM

Shiba Inu Price Prediction: Will Shiba Inu Coin CRASH Soon?
Shib coin news: With Bitcoin hovering around $60,000 and Shiba Inu striving to reach the significant $0.000020 mark, what does the future hold for SHIB price?


More from CryptoTicker