
Ethereum Price Crash Below $3,000 in January 2026: What Happened Next
Ethereum fell below $3,000 on 20 January 2026. The slide went on to about $1,566 in June, and ETH trades near $2,690 in September 2026. The crash analysis, updated.





Which topics should we dive deeper into?
Select what genuinely interests you. Your picks feed directly into our editorial planning.
Crypto news that's actually worth your time.
Weekly. 60 seconds. Carefully curated by our editors: no hype, no promo flood, no spam.
Update 25 September 2026: The warning in this analysis proved right, and the sell-off went much further than the $2,700 demand zone named below. According to CoinGecko daily data, ETH was at about $1,824 on 6 February 2026 and reached its 2026 low of about $1,566 on 26 June. It has since recovered to about $2,690 (CoinGecko, 25 September 2026), which is still below the $3,000 mark this article was about. The January analysis follows as a dated snapshot.
What happened after the January crash?
The break below $3,000 on 20 January 2026 opened a slide that lasted five months. Ethereum stabilised briefly near $2,900 after Davos, when the tariff threats against Europe were withdrawn, as our ETH analysis from 22 January described. Then the decline resumed. CoinGecko daily data show ETH at:
| Date | ETH price (CoinGecko, daily) |
|---|---|
| 20 January 2026 | about $3,187 (start of day, before the break) |
| 1 February 2026 | about $2,451 |
| 1 March 2026 | about $1,967 |
| 26 June 2026 (2026 low) | about $1,566 |
| 1 September 2026 | about $2,467 |
| 25 September 2026 | about $2,690 |
Bitcoin went through the same cycle and touched its 2026 low of about $58,600 on 1 July. Measured against its all-time high of about $4,946 from 24 August 2025, ETH still trades more than 45% lower. Current levels and targets are in our Ethereum price prediction.
The January 20, 2026 analysis
The cryptocurrency market faced a wave of volatility as Ethereum ($ETH), the world's second-largest digital asset, plummeted below the psychologically significant $3,000 mark on January 20, 2026. The move came after weeks of consolidation and failed attempts to breach the $3,400 resistance level.
Ethereum Price Analysis: The Breakdown of $3,200
On the 2-hour chart for ETH-USD, bearish momentum intensified after the price failed to hold the yellow support line at $3,200.
The chart highlights two areas (circled in yellow) where the price interacted with this horizontal level. Initially, $3,200 acted as a local peak and later as support. Then a sharp, high-volume red candle sliced through this floor and accelerated the decline towards the trading price at the time of about $2,992.
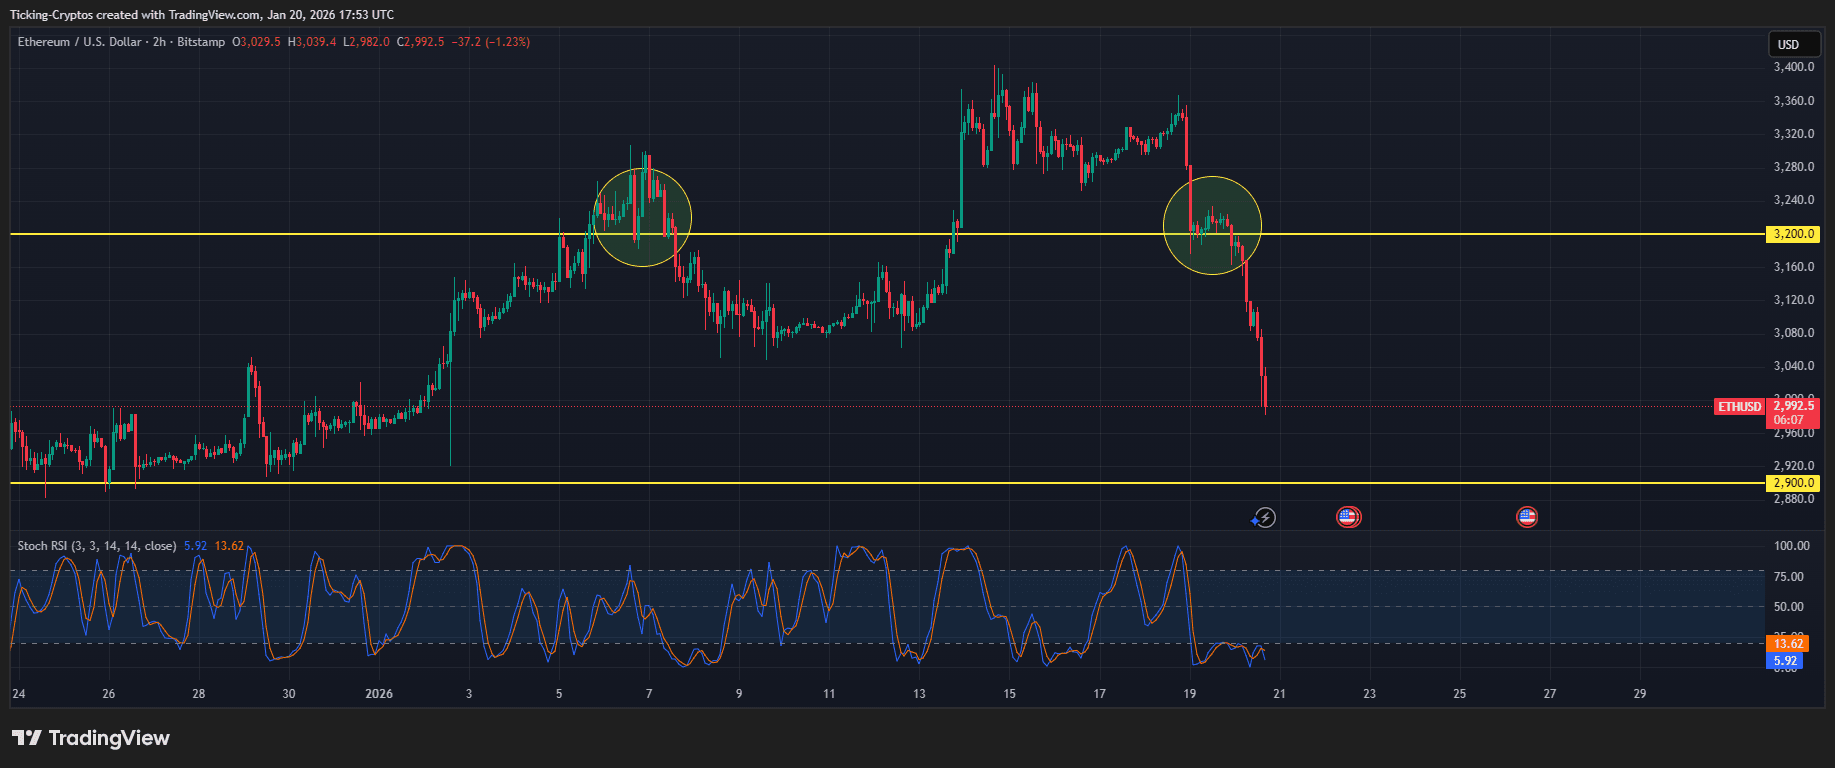
ETH/USD 2H, 20 January 2026, TradingView
- Resistance Turned Support: The $3,200 level flipped back into resistance. ETH did not reclaim it in the following months.
- Next Support Floor: The immediate horizontal support was $2,900 (the lower yellow line). If ETH failed to stabilise there, the analysis saw room for a deeper correction towards the $2,700 demand zone. Both levels gave way by early February.
- Stochastic RSI: The indicator showed a value near 5.92, deep in oversold territory. That often precedes a short relief bounce, but the steep drop suggested that sellers remained in control.
Why Was Ethereum Falling?
The crypto market was in a risk-off phase. Geopolitical tensions, in particular new US tariff threats against European countries over Greenland, and shifts in trade policy led investors to rotate out of high-risk assets such as Bitcoin and Ethereum into safe havens like gold. Our report on Trump's EU tariffs and the Bitcoin price covers the background.
Liquidations of leveraged long positions made the move worse. When ETH dipped below $3,100, a cascade of stop-losses was triggered and provided the liquidity for the sharp vertical drop on the chart.
How to Trade Ethereum in a Crash
The January analysis advised watching the daily close: a failure to reclaim $3,000 quickly would confirm a medium-term bearish trend, and that is what happened. In phases of high volatility, compare liquidity and fees in our exchange comparison before you trade.
For long-term holders, keeping assets off exchanges remains vital. Our hardware wallet comparison shows the current options.
In January all eyes were on the $2,900 support, and the analysis warned that a breakdown could lead to a retest of the 2025 lows. ETH did fall to about $1,566 in June 2026, close to the lows of spring 2025.
FAQ
Why did Ethereum fall below $3,000 in January 2026?
A risk-off move triggered by new US tariff threats against European countries and a cascade of liquidated long positions pushed ETH below $3,200 and then below $3,000 on 20 January 2026.
What was the lowest Ethereum price in 2026?
According to CoinGecko daily data, ETH reached its 2026 low of about $1,566 on 26 June 2026.
Where does ETH trade now?
On 25 September 2026 ETH traded at about $2,690, according to CoinGecko.
Transparency note: This article was produced with the assistance of artificial intelligence and reviewed by our editorial team before publication. All figures and claims were checked against the primary sources linked in the text. The feature image was generated with AI.
More on Ethereum: All Ethereum news at a glance
Related articles
- Ethereum Price Crash: What Next Support Levels For ETH Price Below $3K?
- BREAKING: Ethereum Price Crashes Below $3,000 as Bitcoin Triggers Market Meltdown
- Ethereum Price Prediction: Amid Mixed Signals What To Expect For ETH Price?
- Ethereum Price Crash Below $2,200 – Will $2,000 Hold?
- Crypto Market Crash News As BTC Price Crash Back To 56K
Which topics should we dive deeper into?
Select what genuinely interests you. Your picks feed directly into our editorial planning.
Crypto news that's actually worth your time.
Weekly. 60 seconds. Carefully curated by our editors: no hype, no promo flood, no spam.

January 19, 2026 10:54 AM

Ethereum Price Falls to $3,200 as Whales Buy the Dip: Breakout Coming?
Ethereum trades near $3,200 amid US-EU trade tensions, but on-chain data shows massive whale accumulation from Binance.

May 16, 2026 2:22 PM

Ethereum Price Analysis as ETH risks Crashing below the $2,000 Support
Ethereum struggles to stay above key support levels. Technical charts and rising exchange inflows indicate that ETH could drop below $2,000 soon.
February 18, 2026 6:53 AM

Ethereum Price Prediction: Will the $2,000 Support Hold or Is a Deeper Correction Looming?
Ethereum price struggles to maintain the $2,000 psychological level. Analyze the latest ETH coin news and price predictions for 2026 amid market consolidation.
March 4, 2026 10:29 AM
Ethereum Price Reclaims Crucial Levels as Institutional Rotation Accelerates
Ethereum price shows bullish resilience as it battles key resistance at $2,100. Analysts weigh in on the impact of Harvard’s latest portfolio rotation into ETH.
March 19, 2026 8:37 AM

Ethereum Price DANGER: Will ETH Hold $2,200 Amid Global Macro Chaos?
Ethereum faces a critical test at $2,200 as rising Middle East tensions, hot PPI data, and a hawkish Fed spark a global market sell-off.
January 31, 2026 7:26 PM
Ethereum Crash: ETH Coin Plummets 12% as Volatility Grips Crypto Market
Ethereum price plummeted over 12% in 24 hours, hitting $2,400. We analyze the ETH chart and the macro triggers behind this massive crypto sell-off.
February 6, 2026 7:27 PM

Breaking: Ethereum Price UP Above $2,000 Again, but Traders Remain Cautious
Ethereum price climbs back above $2,000 after a brutal market crash. Technical analysis suggests this relief rally faces massive resistance.
June 23, 2026 4:10 PM

Ethereum Price Prediction: ETH Drops as Ethereum Foundation Cuts 20% of Staff
Ethereum price prediction as ETH drops near $1,660 amid Ethereum Foundation staff cuts.
April 19, 2026 6:34 PM

Ethereum Price Analysis: Key Levels Holding, Will ETH Crash or Bounce Toward $2,500?
Ethereum tests critical support near $2,330. Will ETH bounce toward $2,500 or break lower? Full price analysis and targets.
February 7, 2026 6:30 PM

Ethereum Price Prediction 2026: Technical Analysis of ETH Coin During the Crypto Crash
Ethereum price faces a major test at $1,800. This 2026 technical analysis of the ETH coin explores recovery targets and deeper crash support levels.
June 12, 2024 2:17 PM

Ethereum (ETH) Price Prediction For BULLISH And BEARISH Scenarios
The latest analysis of Ethereum's price movements as of June 12, is divided between the 2 scenarios: bullish and bearish. But what drives each, and which is more likely to occur?
April 6, 2026 6:24 PM

Ethereum Price Analysis: ETH Consolidates Between $1,800 and $2,100, What’s Next?
Ethereum price is stuck in a tight range between $1,800 and $2,100. Analysts warn of a decisive breakout or breakdown as volatility reaches a boiling point.
November 5, 2025 1:16 PM

$1 Trillion Wiped: Risk-Off Storm Engulfs Stocks & Crypto
Global markets plunge as tech stocks and crypto crash, wiping over $1 trillion in value amid AI bubble fears and investor risk-off panic.
April 11, 2026 12:41 PM
Ethereum Price Analysis: Is ETH Gearing Up for a $2,400 Breakout?
Ethereum shows bullish momentum as ETH price eyes the $2,400 resistance. Discover key support levels and technical indicators in our latest analysis.
February 25, 2025 12:14 PM

BREAKING: Ethereum Price Crashes Below $2,500 as Crypto Market Drops 10%
Ethereum crashes below $2,500 as the crypto market drops over 10% in 24 hours. Bitcoin dips under $90K, raising concerns of further ETH declines to $1,800. Here’s what’s causing the crash.
December 19, 2024 11:38 AM

Is an Ethereum Price Crash Imminent?
Ethereum price has dipped igniting fears of a potential price crash. Analysts highlight bearish signals, but some still predict a recovery. Which is it next?
April 8, 2026 10:34 AM
Ethereum Price Surges Past $2,250 as Geopolitical Relief Sparks Altcoin Rally
Ethereum price has surged over 6% in the past 24 hours, reclaiming the $2,250 level following a major geopolitical de-escalation announcement by President Trump.
January 30, 2026 10:12 AM

Crypto Crash Reason: Why is Bitcoin Crashing Today and Key Supports
The crypto market is facing a sharp correction. What are the crypto crash reasons today, and what are Bitcoin support levels, and how are macro factors hitting prices?
June 24, 2024 8:16 PM

Bitcoin News Today: Bitcoin CRASH OVER or MORE Down To Go?
Bitcoin Price Crash below 60k, and the crypto market follows. Why this decline and how low can it go?
February 24, 2026 10:30 AM

4 Altcoins Flashing Major Sell Signals: What Happens if Key Supports Break?
The crypto market is on edge as Bitcoin and major altcoins like ETH, SOL, and XRP approach "make-or-break" support levels. Is a deeper crash imminent?
March 17, 2025 8:14 PM

Ethereum Price Prediction: Will ETH Price Crash below $1K Ahead of the FOMC Meeting?
With the FOMC meeting approaching, Ethereum's price faces uncertainty. Will ETH crash below $1,000 or hold strong? Here's what to expect in the coming days.
January 15, 2026 4:40 PM

Ethereum Price Prediction: Will ETH Break $4,000 in Q1 2026?
Ethereum is showing strong bullish momentum in early 2026. Can ETH break the $4,000 barrier? Here's what's happening to Ethereum coin price.
June 25, 2024 12:18 PM

After Bitcoin Crash, Will Altcoins Gains Reach 500%?
In the latest Bitcoin News today, and mainly after the Bitcoin Crash, crypto analysts predict a major shift towards altcoins with market corrections near the end and BTC dominance drop. Will the altcoins gain reach 500%?
April 22, 2026 9:11 AM

Bitcoin Price Hits $78,000 as Ceasefire Extension Ignites Bullish Momentum
Bitcoin breaches $78,000 following the US-Iran ceasefire extension and a $2.5 billion MSTR purchase. Here is the weekly BTC chart for key 2026 price targets.
July 1, 2024 9:20 AM

Bitcoin News Today: Why Is Bitcoin Price Up Starting July?
Starting July, recent market movements, political debates, and court rulings are shaping the future of Bitcoin and the broader crypto market. Here are the latest insights and analysis...



More from CryptoTicker