
Bitcoin price at $82,749 as the daily range shrinks to a third: the levels that count before Wednesday's CPI
Bitcoin stands at $82,749 and the daily range has fallen to 0.74 percent, less than a third of the weekly average. The US consumer price index lands on Wednesday: these are the levels that count until then.





Which topics should we dive deeper into?
Select what genuinely interests you. Your picks feed directly into our editorial planning.
Crypto news that's actually worth your time.
Weekly. 60 seconds. Carefully curated by our editors: no hype, no promo flood, no spam.
Bitcoin stands at $82,749 on Saturday afternoon, which is around 73,863 euros. Over the past 24 hours the price has moved by 0.2 percent; measured across the week it is 2.1 percent lower. Set against the days before it, that is close to standstill. And that standstill is the story of the day, because Wednesday brings the US consumer price index, the appointment likely to set the direction for the coming weeks.
Anyone looking at the Bitcoin chart today sees little. Anyone looking at the range sees something that can be put in figures: the gap between the daily high and the daily low has fallen to less than a third of the weekly average. This article tells you which levels count coming out of that calm, what happens on Wednesday at 2.30 p.m. German time, and which three figures in your own portfolio should be settled beforehand.
Bitcoin price at $82,749: the figures on Saturday afternoon
The price has been moving in a narrow band since the morning. The 24-hour high stands at $83,204, the low at $82,229. Between the two lie $975, or 1.2 percent. For comparison: on Thursday, $3,136 lay between high and low.
Converted into euros, Bitcoin stands at around 73,863 euros. The figures come from CoinGecko, as of Saturday, October 10, early afternoon. For context: a good 34 percent currently separates the price from its record of $126,080.
A brief definition, because it carries the rest of the article. The daily range is the distance between the highest and the lowest price of a day, expressed as a percentage of the daily low. The figure measures how far the market swung on a given day, irrespective of where it ends up. A day can close at plus zero percent and still have had a range of four percent.
0.74 percent: the narrowest range of the week
For this article we evaluated CoinGecko's four-hour candles for the past two weeks and determined the high and low for each calendar day from them. The result for the past seven days, in each case as the percentage gap between daily high and daily low:
- Sunday, October 4: 1.12 percent
- Monday, October 5: 2.28 percent
- Tuesday, October 6: 1.79 percent
- Wednesday, October 7: 3.42 percent
- Thursday, October 8: 3.90 percent
- Friday, October 9: 2.24 percent
- Saturday, October 10 up to the early afternoon: 0.74 percent
The six days before today average 2.46 percent. The running Saturday sits at 0.74 percent and therefore at just under 30 percent of that value. The day is not over yet, so the range can still grow. Even if it doubled by midnight, it would stay below the week's average.
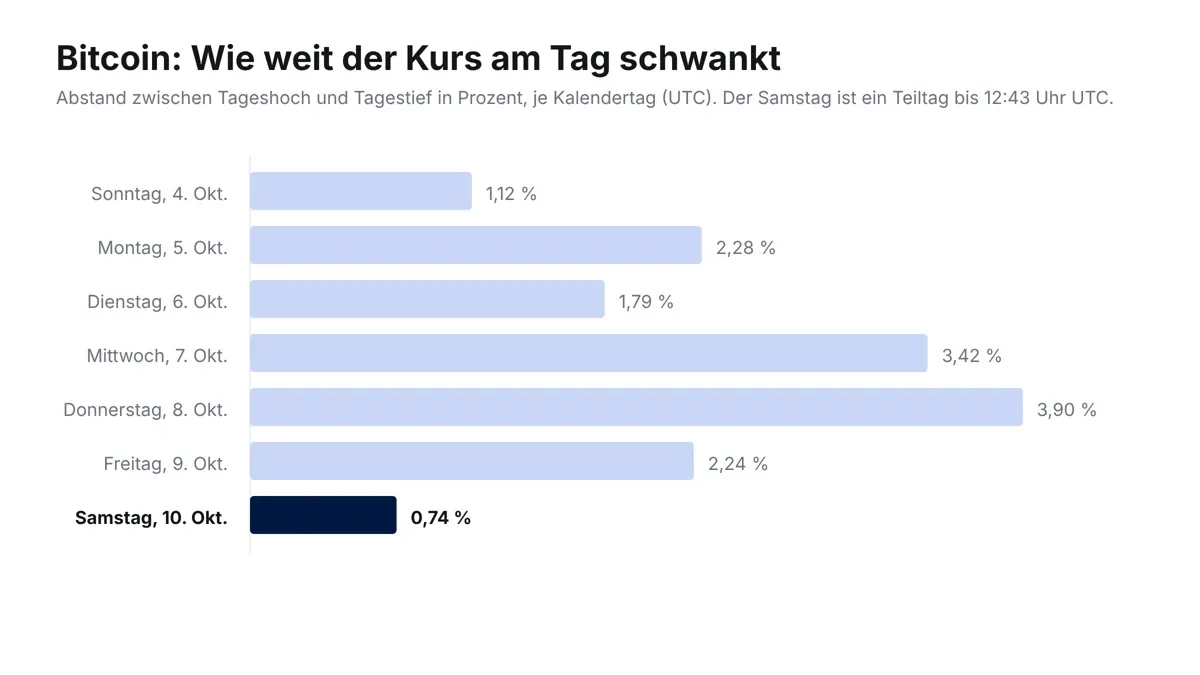
That Saturdays run quieter than weekdays is normal: the US exchanges are closed, the ETF counters stand still, institutional orders pause. What is remarkable is the margin. The previous Saturday, October 3, came to 0.93 percent, and the Sunday after it to 1.12 percent. So today is narrow even for a Saturday.
 Buying crypto in Europe: the exchanges compared
What has changed since Friday
On Friday we wrote in this slot about the Bitcoin price and the oil price. Bitcoin stood at $82,991 at the time, Brent had fallen to $103.53, and the question was whether a retreating oil price relieves the crypto market.
Since then almost nothing has happened to the price: $82,749 today against $82,991 on Friday afternoon is a difference of $242, or 0.3 percent. What has changed is something else, namely the movement itself. On Friday the price still swung 2.24 percent within the day, today 0.74 percent. The $82,000 level, briefly breached on Thursday evening, has not been touched since early Friday. Thursday's low of $80,427 has therefore stood unchallenged as the week's lowest point for two days.
For you as a reader following this thread, that means the question has shifted. Last week it was about whether the slide would continue. That question has been answered for now; it did not continue. Now it is about which direction the market comes out of this calm in, and what pushes it there.
Why a narrow range ahead of a data release is no cushion
The mechanism behind it is less mysterious than it is often made out to be, and it can be explained in three steps.
First: when the price barely swings for hours, measured volatility falls, and the risk models of trading houses hang on it. Lower measured volatility allows those same models a larger position on the same risk budget. So positions tend to get bigger, not smaller.
Second: in the futures market, stop orders and liquidation thresholds gather close together in such phases, because many participants set their levels at the same visible points, at the daily high, at the daily low, at a round number. The narrower the range, the closer together those points lie.
Third: when a piece of news then forces a direction, those thresholds get touched in quick succession. Every triggered liquidation is a market order that pushes the price further in the same direction and reaches the next threshold. That is how a cascade forms.
What that looks like in practice could be observed on Thursday of this week. We analysed at the time that 94 percent of Dogecoin liquidations hit long positions, meaning bets on rising prices. Bitcoin fell from $83,563 to $80,427 that day. The trigger was no catastrophe but a chain of the oil price and restrained expectations of the US Federal Reserve.
The CPI on Wednesday, October 14: what happens at 2.30 p.m. German time
On Wednesday the US Bureau of Labor Statistics publishes the consumer price index for September. The time is 8.30 a.m. local time on the US East Coast, so 2.30 p.m. in Germany. The CPI, short for consumer price index, measures how much a fixed basket of goods and services has risen in price against the same month a year earlier. It is the single most important figure for rate expectations in the market.
Why this release matters for Bitcoin: the expectation of whether and how far the US Federal Reserve cuts rates moves the dollar and the appetite for risk across all markets. Rising inflation argues against rate cuts, and rate cuts failing to arrive have regularly weighed on crypto prices over the past two years. The link is not mechanical, but it has been stable enough since 2022 that trading desks position themselves accordingly.

Two things make this Wednesday particular. For one, analysts cited by Admiral Markets expect the annual rate to rise from 3.4 to between 3.6 and 3.7 percent, driven above all by petrol prices in September. For another, it is the last inflation figure before the US Federal Reserve's rate decision on October 28. A reading markedly above expectations would therefore meet a market that has no further opportunity to reorganise itself before then.
You can look up the release date itself at the US Bureau of Labor Statistics, where the publication calendar is kept.
Bitcoin is holding up better than the altcoins: the weekly balance
A second perspective alongside the chart is the comparison within the market. Over the past seven days the large names stand as follows:
- Bitcoin: minus 2.1 percent
- Shiba Inu: minus 4.1 percent
- XRP: minus 5.4 percent
- Ethereum: minus 7.0 percent
- Chainlink: minus 7.1 percent
- Dogecoin: minus 7.6 percent
- Solana: minus 8.1 percent
So Bitcoin has taken on around a quarter of Solana's loss and a good third of Dogecoin's. In market phases where money moves out of risk, that is a familiar pattern: the smaller names give way more strongly, because their order books are thinner and because investors sell first where the leverage was greatest.
For placing today, that means the quiet range in Bitcoin is no sign of general market calm. The picture shows rather that Bitcoin is at present the most stable part of a market that is giving way overall.

The levels to the upside: $83,204 and $84,150
To the upside, two points can be justified. The first is the 24-hour high at $83,204. It is the boundary of the current range, and a break above it would be the first signal that the calm is ending upwards.
The second lies higher. The analysis service DiarioBitcoin locates the next resistance in the zone between $84,150 and $84,260, and points out that the price trades below the moving averages of the past 7, 15 and 20 days while still sitting above those of the past 30, 50, 90 and 200 days. Trading volume there is below the average of the past 30 days, which fits the picture of a narrow range.
What that distance means in practice: from the current level to the upper zone is around 1.7 percent. That is a move the market has managed several times on a normal trading day this week.
The levels to the downside: $82,229 and $80,427
To the downside, the first level is the 24-hour low at $82,229, a good 0.6 percent below the current price. That marks the lower edge of the calm zone.
The second and more important level is the weekly low at $80,427 from Thursday evening. The weekly low sits around 2.8 percent below the current level. What is special about it is not the number but what it marks: the price was last below that point in early September. A break beneath it would not merely repeat Thursday's slide but extend it.
The analysis service Börse Global additionally names the round $83,000 as a short-term decision level and sees the zone around $80,000 in focus on a slip below it. Both assessments point in the same direction: between a good $80,000 and a good $84,000 stretches the frame in which the coming days will be decided.
Leverage and liquidation: three figures that should be settled before Wednesday
When the range is narrow and a release is pending, the obvious action is not to guess a direction. It makes more sense to know your own figures beforehand. Three of them can be calculated concretely.
First, the liquidation price. Anyone holding a leveraged position finds it in the position overview at their exchange. What matters is the distance to the current price in percent. If it is under 3 percent, it lies within what Bitcoin covered on each of this Wednesday and last week's Thursday in a single day. Anyone working with leverage should additionally know how the funding rate and the settlement work on their platform, because both shift the liquidation price over the holding period.
Second, the holding period. In Germany, gains from selling cryptocurrencies are tax-free after a holding period of one year; within the year the exemption threshold of 1,000 euros per calendar year applies. Anyone holding balances close to the year-end cut-off should know which part of the holding was bought when, before reacting in panic on Wednesday. What comes together for tax purposes in October this year is set out in our article on Bitcoin tax and the December 31 cut-off.
Third, the buying route. Anyone wanting to buy more should $80,427 be tested needs the route beforehand, not in the moment of the move. Verification at a new exchange takes hours to days, a bank transfer overnight. Which providers are authorised in Germany under the MiCA regulation and what they cost per order is set out in our crypto exchange comparison.
Our assessment of the situation ahead of Wednesday
In the editorial team's view, the narrow range is the most remarkable signal of this weekend, and it argues for tension rather than relief. The evidence: at 0.74 percent, the range sits at less than a third of the weekly average of 2.46 percent, trading volume is below the 30-day average as measured by DiarioBitcoin, and the market has the CPI on Wednesday ahead of it, the last inflation figure before the rate decision on October 28.
What argues against overstretching this reading: a quiet Saturday is first of all a Saturday. October 3 came to 0.93 percent without an extraordinary week following it. And the direction in which a market emerges from a narrow phase cannot be derived from the narrowness itself; it says something about the possible force of the move, nothing about its sign.
What follows from that is therefore not a directional bet but a question of preparation: the two levels of $82,229 and $80,427 to the downside, along with $83,204 and the zone around $84,150 to the upside, are the points at which Wednesday will show where the market wants to go.
Bitcoin before the CPI: $82,229 is the first level on Wednesday
To take away, in the order in which the three steps make sense:
- Recalculate your own thresholds. Note the liquidation price and its distance to the market in percent. If that distance is under 3 percent, it lies within a normal daily move of this week. The settlement models of the leverage platforms are in the perp DEX comparison.
- Settle the buying route beforehand. Verification, payment method and order fee are fixed before a level is tested, not after. The providers authorised in Germany and their cost per order are in the exchange comparison.
- Put the date in the diary. Wednesday, October 14, 2.30 p.m. German time. Anyone with an order open at that moment should know that spreads regularly widen in the minutes afterwards. Anyone preferring to track the move through an exchange-traded product will find the routes tradable in Germany in the overview of crypto ETFs and ETPs.
(As of October 10, 2026. This article is not investment advice. Prices and fee structures change; check the terms with the provider before you buy.)
Frequently asked questions about the Bitcoin price
Transparency note: This article was produced with the assistance of artificial intelligence and reviewed by our editorial team before publication. All figures and claims were checked against the primary sources linked in the text. The feature image was generated with AI.
Related articles
- Why Did Bitcoin Price Crash below 80k Today?
- Breaking News: Will This Volatile Summer End With Bullish Signs For Bitcoin Price?
- Bitcoin Price Analysis: Why Is BTC Price Up TODAY?
- Bitcoin Price Hits $78,000 as Ceasefire Extension Ignites Bullish Momentum
- Bitcoin Price Prediction: Can BTC Reach $70,000 After the CPI Test?
Which topics should we dive deeper into?
Select what genuinely interests you. Your picks feed directly into our editorial planning.
Crypto news that's actually worth your time.
Weekly. 60 seconds. Carefully curated by our editors: no hype, no promo flood, no spam.

September 6, 2026 11:19 AM
Bitcoin Price Today: BTC Holds Firm Before The Biggest Week Of The Month
Bitcoin sits near $80,000 after a jobs report killed a four-month high. CPI, the Fed and a Senate vote all land in the next ten days.
January 14, 2026 2:47 PM

Crypto Markets on Edge on 14 January 2026: US PPI Surprise Ahead of the Tariff Ruling
Hot US producer prices and a pending Supreme Court tariff ruling kept crypto on edge on 14 January 2026. The ruling came on 20 February, and the Fed later raised rates.
July 13, 2026 4:27 PM

Why Is Bitcoin Price Down Below $63,000 Today?
Bitcoin slipped as Middle East tensions rattled markets, yet ETF flows just flashed a bullish signal. Here is what is driving crypto today.

June 18, 2026 9:43 AM

Oil Crashes 38% to a 3.5-Month Low — Why This Is Bullish for Crypto
Oil crashed 38% to $74, near pre-war levels. Lower oil means lower inflation and more rate-cut odds — and that's a tailwind for Bitcoin and crypto.
June 1, 2025 11:53 AM

Bitcoin News: BTC USD Holds $103K Amid Global Accumulation
Bitcoin News Today: $BTC USD holds strong above $103K as institutional whales load up. Can $Bitcoin reclaim $110K this June?
April 9, 2026 4:02 PM

Oil Back at $100, Inflation Rising — Why Crypto’s Next Move Could Be Violent
Oil above $100 is fueling inflation fears and pressuring crypto markets. Will Bitcoin crash or surge next? Key levels and scenarios explained.
May 20, 2026 10:40 AM
Bitcoin Price Stabilizes Above $77,000 as Daily Chart Shows Crucial Test
Bitcoin is trading at $77,371 following an $83,000 peak rejection, testing key daily moving average support zones amid macroeconomic friction.
May 6, 2026 3:16 PM

Trump Warns Iran: Bitcoin Price Dips to $81,600 as Geopolitical Tensions Flare
Bitcoin drops from $82,800 to $81,600 following Trump’s latest Iran warning. Is this a trend reversal or just a healthy market correction?
April 17, 2026 9:21 AM

Bitcoin News Today: BTC Coin Hits $75,000 as US Treasury Injects $15B Liquidity
Bitcoin price breaks $75,000 for the first time in 73 days. Read why the massive US Treasury buyback and BlackRock inflows are fueling this historic BTC rally.
October 1, 2026 7:25 AM

US core inflation falls to 3.0 percent: what investors need to know before the Fed decision on October 28
US core inflation ran at 3.0 percent in August, clearly below the expected rate. That shifts expectations for the Fed meeting on October 28 and helps decide how much room the Bitcoin price gets in the fourth quarter.
August 12, 2025 2:05 PM

Crypto Market Outlook After US Inflation Data: Bitcoin Eyes $125K as CPI Hits 2.7%
US CPI lands at 2.7%, boosting hopes for September rate cuts. Bitcoin eyes $125K while altcoins prepare for possible rallies.
July 14, 2026 5:02 PM

Bitcoin Price Breaks $64,000 as CPI Inflation Cools — Rate Cut Bets Surge
Bitcoin breaks $64,000 and Ethereum nears $1,900 as CPI inflation cools to 3.5%, liquidating $135M in shorts and fueling rate cut bets.
April 18, 2026 12:59 PM

Iran Closes Strait of Hormuz Again: Oil Rises as Crypto Crash
Iran has officially closed the Strait of Hormuz citing a US blockade. Oil prices jumped to $83 while Bitcoin dropped to $76,000 amid rising geopolitical tension.
March 9, 2026 10:20 AM
Crypto Market News: Bitcoin Price Battles $67k as US CPI and CLARITY Act Loom
Bitcoin recovers to $67,500 while the market eyes US CPI data and the CLARITY Act. Discover the key events driving crypto prices next week.
June 6, 2025 12:59 PM

Bitcoin Price Prediction: BTC USD Targets $120,000 After Current Consolidation
Bitcoin trades near $105,000 in June 2025 following May's record high of $112,000. However, technical indicators suggest a breakout to $120,000 in coming weeks.
June 15, 2025 6:05 PM

Bitcoin Price USD Holds Above $105K as Geopolitical Tensions Rise, BUT What's Next?
Bitcoin is consolidating just above $105,000, but with rising tensions in the Middle East, the next big move could come fast. Here’s what the charts and macro signals reveal.
December 12, 2024 11:28 AM

Bitcoin Hits $100K Again – But a Crash to $60K Might Be Next
Bitcoin is back at $100K after dropping to $94K, but concerns are growing as BTC faces strong resistance at $104K. Will the bullrun continue, or is a major crash coming in January?
August 30, 2026 1:32 PM
Bitcoin Price Correction: Why BTC Stalled Dead at $78,000 Again
Bitcoin corrected from $81,455 after a hawkish Fed. The chart shows the exact same rejection level as May. Here are the upside and downside targets.
June 19, 2025 9:15 AM

Bitcoin Price USD Outlook: Will $100K Hold or Is a Deeper Breakdown Coming?
The Bitcoin price (USD) is testing key support levels again. With a descending triangle forming and the $100K level in focus, traders are watching for the next big move. Is now the time to buy—or bail?
January 9, 2025 3:30 PM

2025 Bitcoin Price Prediction: What if BTC Price breaks below $90K Support?
The 2025 Bitcoin price prediction hinges on its critical $90,000 support level. Will it hold, or could we see declines to lower levels? Explore key insights shaping the short-term Bitcoin trajectory.
July 1, 2024 9:20 AM

Bitcoin News Today: Why Is Bitcoin Price Up Starting July?
Starting July, recent market movements, political debates, and court rulings are shaping the future of Bitcoin and the broader crypto market. Here are the latest insights and analysis...
July 14, 2026 9:55 AM
Bitcoin Price Stuck at $60K: 3 Events This Week Could Unlock the Next Big Move
Bitcoin is pinned to the $60K line as Extreme Fear grips the market. But three catalysts landing over the next 48 hours could finally shake crypto out of its deadlock — here's what to watch.
February 19, 2026 11:26 AM

Crypto News Today: BTC Slips as US-Iran Tensions and Hawkish Fed Spark "Risk-Off"
Bitcoin struggles near $68,000 as US-Iran geopolitical tensions and hawkish Fed minutes rattle investors. Get the latest crypto news today.
January 25, 2026 10:47 AM

US Government Shutdown 2026: Why Polymarket Odds Just Hit 78%
Prediction markets signal a potential US government shutdown on January 31, 2026. Here's how this political gridlock could trigger a crypto market breakout.
August 17, 2024 2:55 AM

Bitcoin Price Prediction: How Will BTC Price Move Following Gold's Surge?
Will Bitcoin break through resistance and rally, or are there further declines on the horizon, for the second half of August? This is the latest analysis of Bitcoin’s price...


More from CryptoTicker