Trump Warns Iran: Bitcoin Price Dips to $81,600 as Geopolitical Tensions Flare
Bitcoin drops from $82,800 to $81,600 following Trump’s latest Iran warning. Is this a trend reversal or just a healthy market correction?


Geopolitical Shockwaves Hit Bitcoin
The cryptocurrency market experienced a sudden wave of volatility today after U.S. President Donald Trump issued a stern warning regarding the ongoing tensions with Iran.
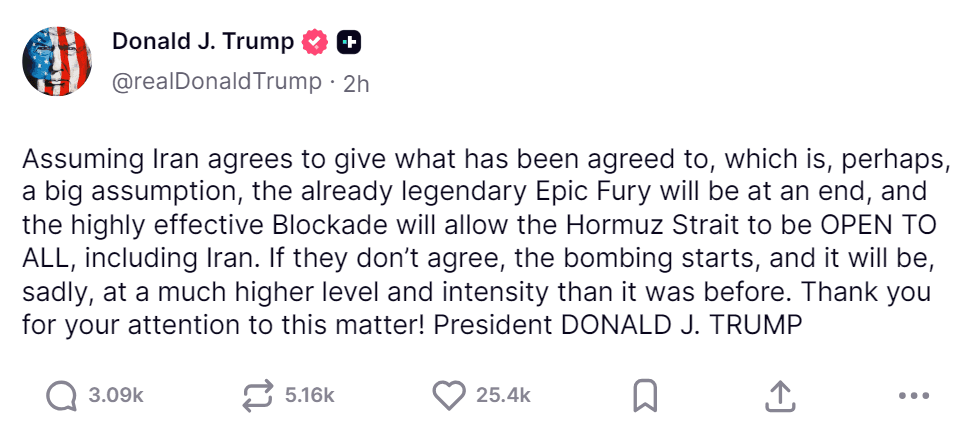
The impact on Bitcoin ($BTC) was instantaneous. The premier digital asset, which had been trading at a local high of $82,800, tumbled to $81,600 within minutes of the post. This move wiped out gains from the previous 24 hours, leaving traders questioning if the bull run is under threat or if this is simply "noise" in a larger uptrend.
Why Did Crypto Crash?
While Bitcoin is often touted as "digital gold," its short-term price action remains highly sensitive to macro-geopolitical risks. The threat of renewed military action often leads to a "risk-off" sentiment where traders exit speculative positions to move into cash or traditional hedges.
However, the current dip of roughly 1.5% is relatively minor when compared to the parabolic growth Bitcoin has seen throughout the first half of 2026. Data from major exchanges shows that while liquidations spiked, buy orders at the $81,000 level remain robust.
 Crypto Exchange Check: Who is the Test Winner? Get the Most Out of Your Investment
Bitcoin Price Analysis: A "Normal" Adjustment?
Looking at the 30-minute BTC/USD chart, the recent drop appears less like a catastrophic crash and more like a standard technical pullback.
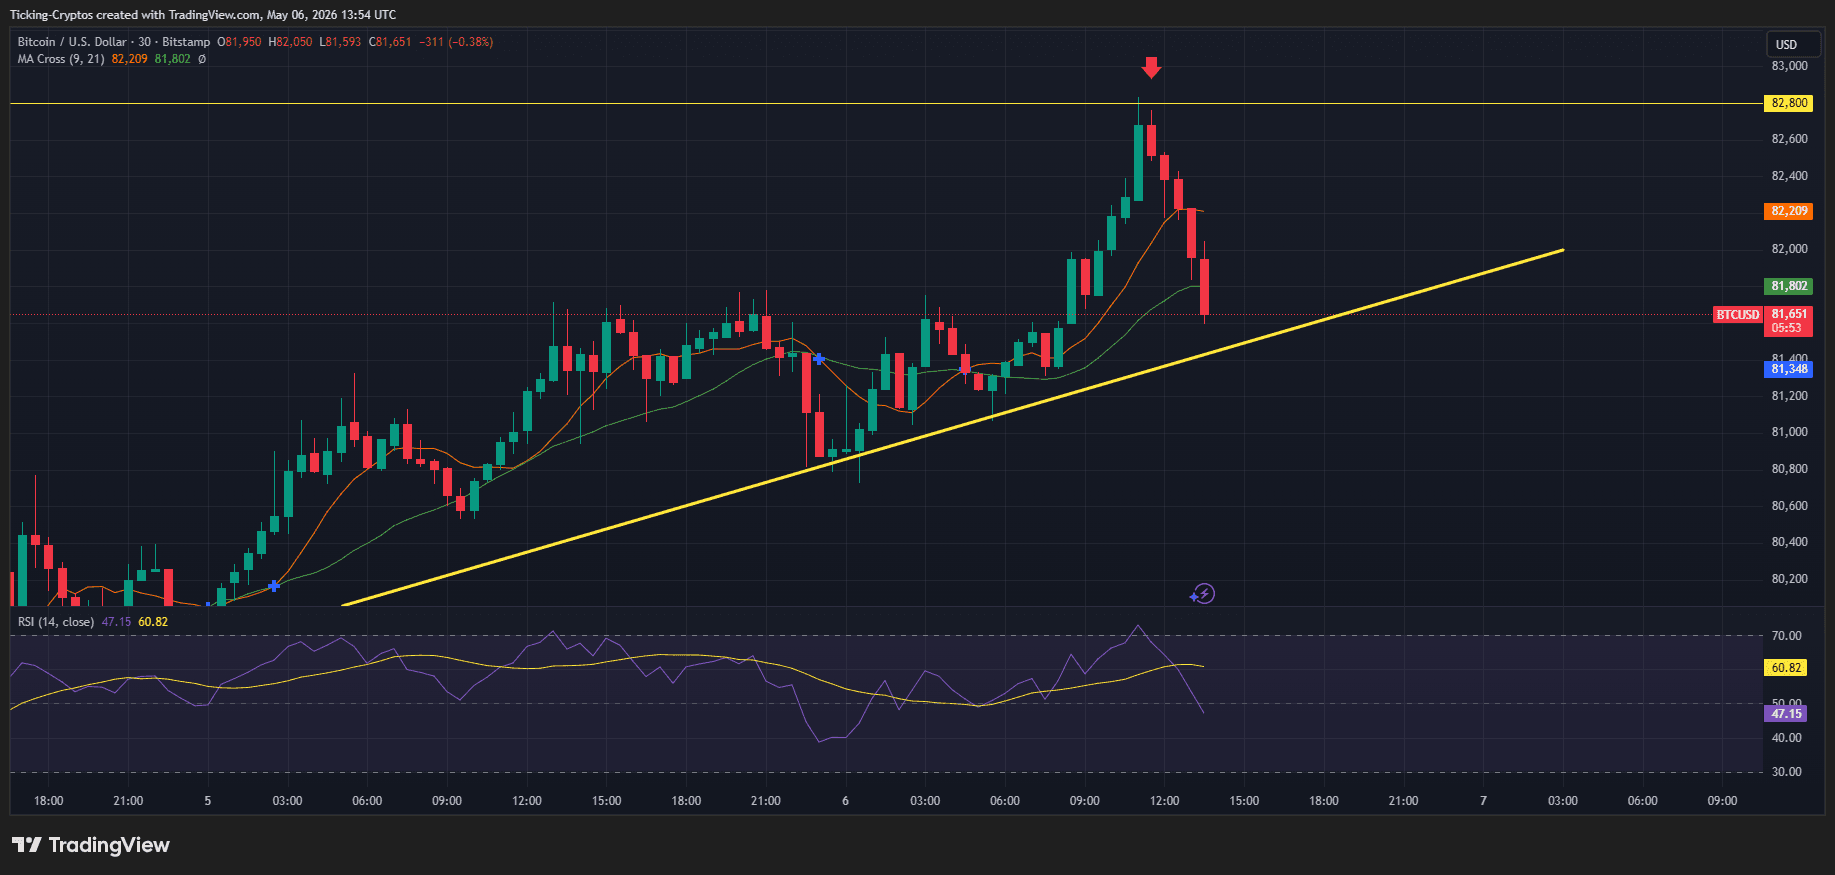
1. The Ascending Support Line
Bitcoin has been following a well-defined yellow trendline (ascending support) for several days. Even with the drop to $81,651, the price remains significantly above this trendline. As long as BTC holds above the $81,300 mark, the structure of the uptrend remains technically intact.
2. Moving Average Cross
The Moving Average (MA) Cross (9, 21) shows that the price is currently testing the short-term averages. A brief dip below the orange line is common during "news-driven" volatility. The "red arrow" on the chart indicates the peak at $82,800, which now serves as the immediate resistance to beat.
 Tax season is right around the corner. Did you pick a crypto tax tool yet? Check out our comparison
3. RSI Normalization
The Relative Strength Index (RSI) had reached overbought territory (near 70) during the climb to $82.8k. The "Trump Dip" has effectively cooled the RSI down to 47.15, which is neutral. This "reset" is often healthy for a market that is overheating, providing the necessary room for a move toward $85,000.
What Happens Next?
Geopolitics will likely dictate the price action for the remainder of the week. If diplomatic talks between the U.S. and Iran show signs of progress, Bitcoin could reclaim the $82,800 level quickly. Conversely, if the rhetoric escalates into actual kinetic action, we might see a test of the $80,000 psychological support.