Ethereum is the Most Likely Candidate to Take The Lead of the Next Bull Run
The majority of top cryptocurrencies have been flat for the past two months. The significant recovery after the overall crash on March 12 due to the coronavirus pandemic was halted after fears about a possible second wave resurfaced. Bitcoin has […]

The majority of top cryptocurrencies have been flat for the past two months. The significant recovery after the overall crash on March 12 due to the coronavirus pandemic was halted after fears about a possible second wave resurfaced.

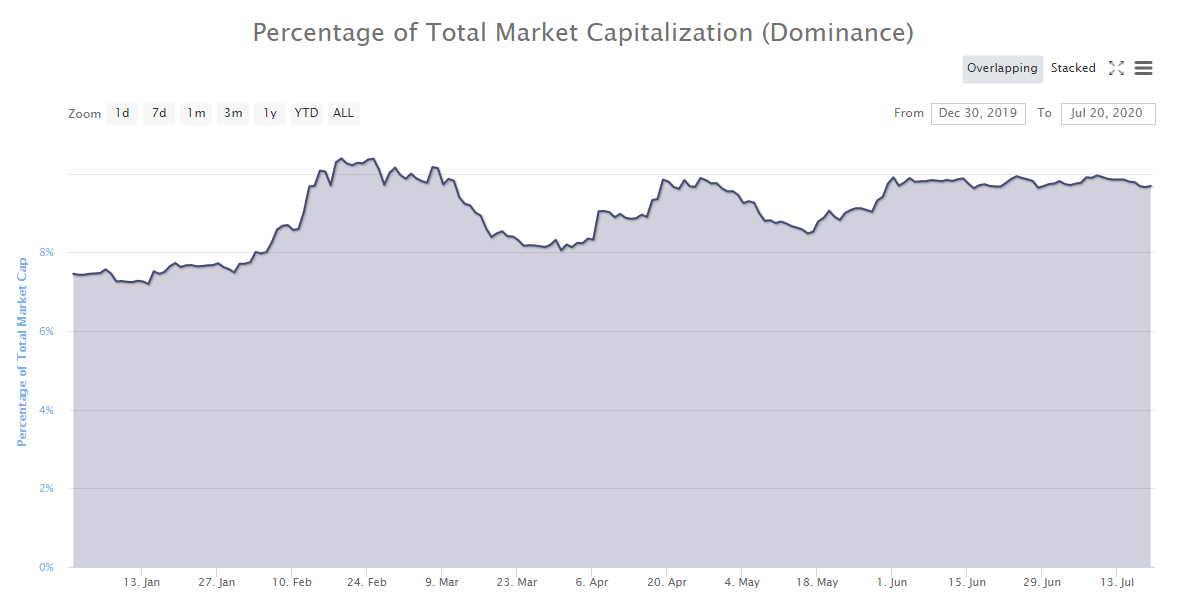
Bitcoin has been losing market dominance for the past three months dropping to a 62% low, Ethereum, however, has been actually increasing in dominance. Back in January 2020, ETH had around 7.4% dominance and has been slowly climbing to a current 10%.
This increase might not look that significant but it is notable considering most of the top cryptocurrencies have been losing a lot of dominance. Bitcoin, XRP, Bitcoin Cash, Litecoin, and even Binance Coin, all have been losing dominance.
Clearly, Ethereum is the one in the driver seat right now and more technical indicators are showing it could be the leader of the next bull run.
Ethereum Technical Analysis Indicates a Breakout is Nearby
So what makes Ethereum different than Bitcoin or XRP? For one, Bitcoin is only up 140% since its 2020-low on March 12 while Ethereum is up 180%. When it comes to trading volume, Ethereum falls in the same category as everyone else, seeing a significant decrease in volume over the past three months.
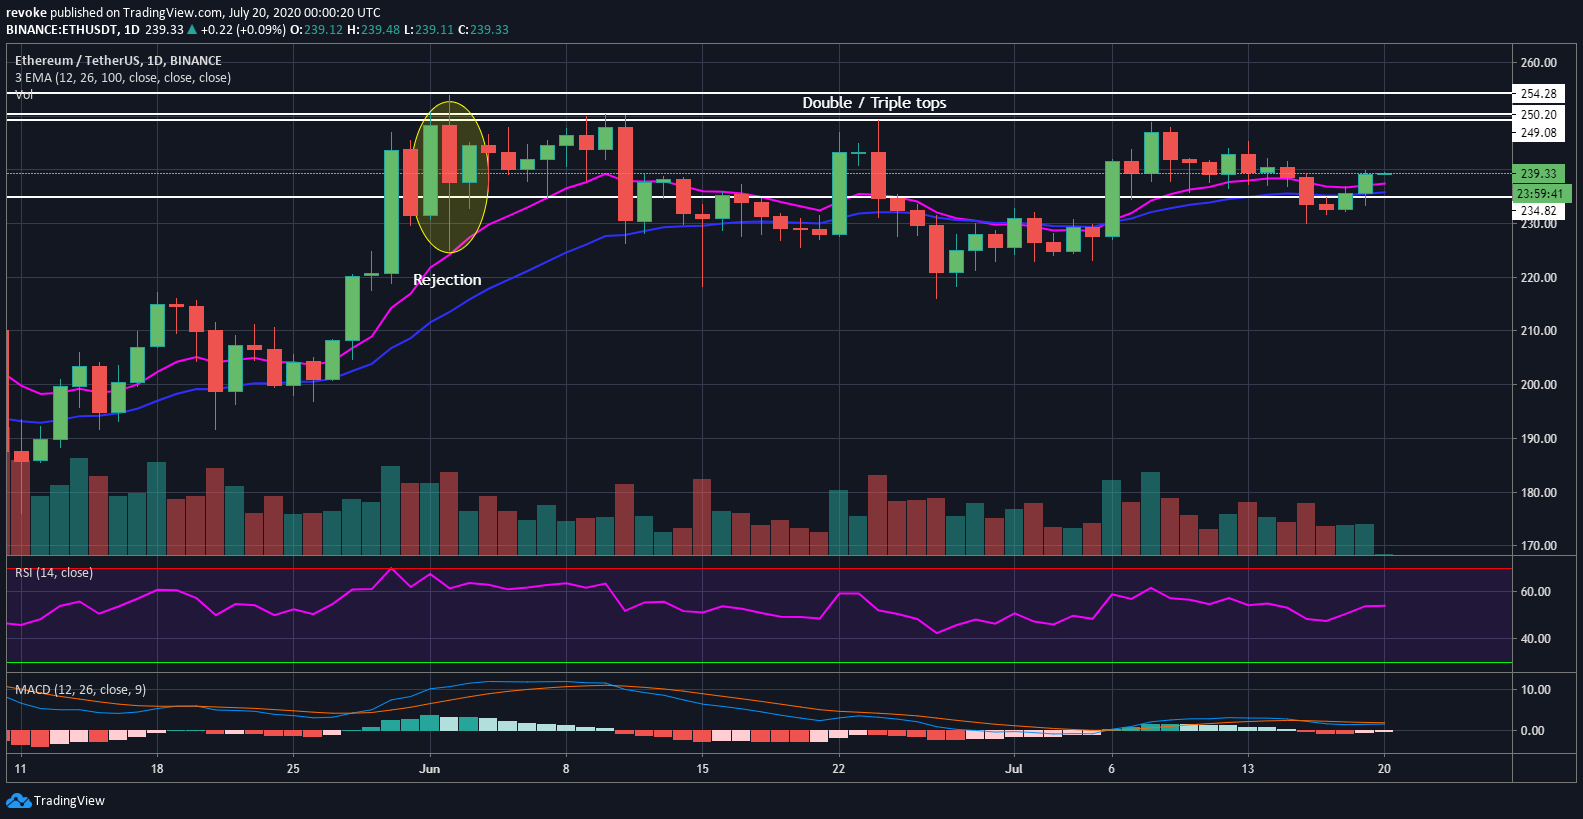
Ethereum has been showing more positive signs than Bitcoin, some of them are barely noticeable but they are there. Let’s take a look at the most significant rejection for Bitcoin on June 2 after climbing above $10,000 and hitting $10,380 on Binance.

The rejection led Bitcoin to paint lower highs on the daily chart for the next month and a half. While Ethereum also had a strong rejection on June 2, the digital asset mostly had a double or possibly a triple top and both the 12-EMA and the 26-EMA have remained bullish.
These two key differences are enough to indicate that Ethereum is simply stronger than Bitcoin right now. It’s important not to forget that Ethereum was actually fairly close to overtaking Bitcoin once.
Obviously, that’s far from happening now but, the Ethereum ecosystem keeps growing tremendously and the release of Ethereum 2.0 will be one of the biggest events ever and will very likely translate into a bull run in the long-term.
Long-Term Metrics for Ethereum
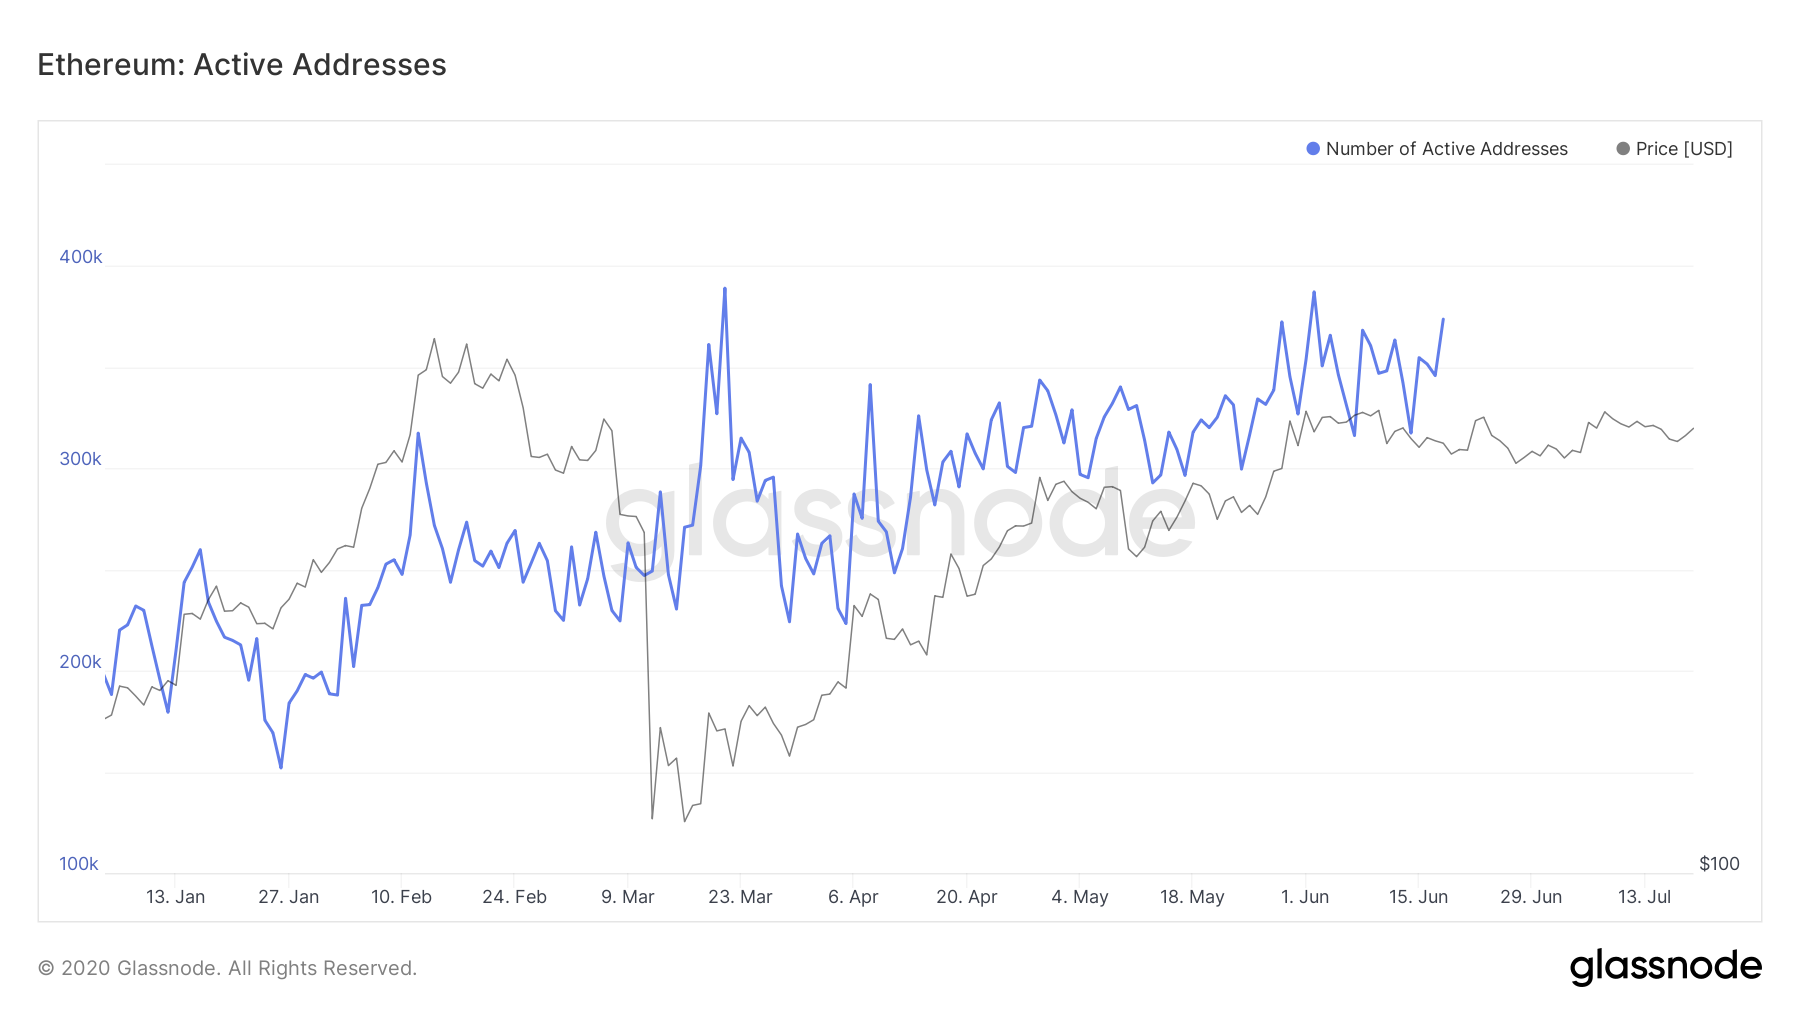
The first metric we are going to look at is the number of new non-zero addresses. According to Glassnode, Ethereum is seeing a significant increase in this number throughout 2020. Perhaps a more important statistic is the number of active addresses which has also been climbing regularly.

The number of addresses with a balance over 32 Ethereum has also been increasing, however, this number has been increasing basically since the inception of Ethereum.
A more significant metric is the number of Ethereum addresses with a balance equal or over 100 coins. This number has increased as well, from a low of 46,795 addresses to a peak of 47,823, basically 1,000 more addresses in 2020.
Of course, these are only metrics and they do not affect Ethereum’s price directly or in the short-term but they still show a clear interest in the digital asset and the potential fo Ethereum in the long-term.


