Breaking News: Bitcoin Breaches $11,300 convincingly
Bitcoin price has finally cracked $11,000 on basically all exchanges including Binance and Bitfinex. This crucial resistance level has been held for a long time and now Bitcoin is exploding to the upside with very little resistance until $12,300. BTC/USD […]


Bitcoin price has finally cracked $11,000 on basically all exchanges including Binance and Bitfinex. This crucial resistance level has been held for a long time and now Bitcoin is exploding to the upside with very little resistance until $12,300.
BTC/USD 5-minute chart

Bitcoin just exploded above $11,000 after a breakout above $10,000 on July 27. The rank 1 digital asset is now free to climb up to around $12,300, the next important resistance level.
The current bullish momentum is extremely strong and FOMO is starting to be a factor. The RSI is overextended on most time frames but that might not stop Bitcoin in the short-term.
Currently, we also have a short-squeeze, which means short orders that were opened below $10,000 are getting liquidated at massive rates pushing the price of Bitcoin even further up.
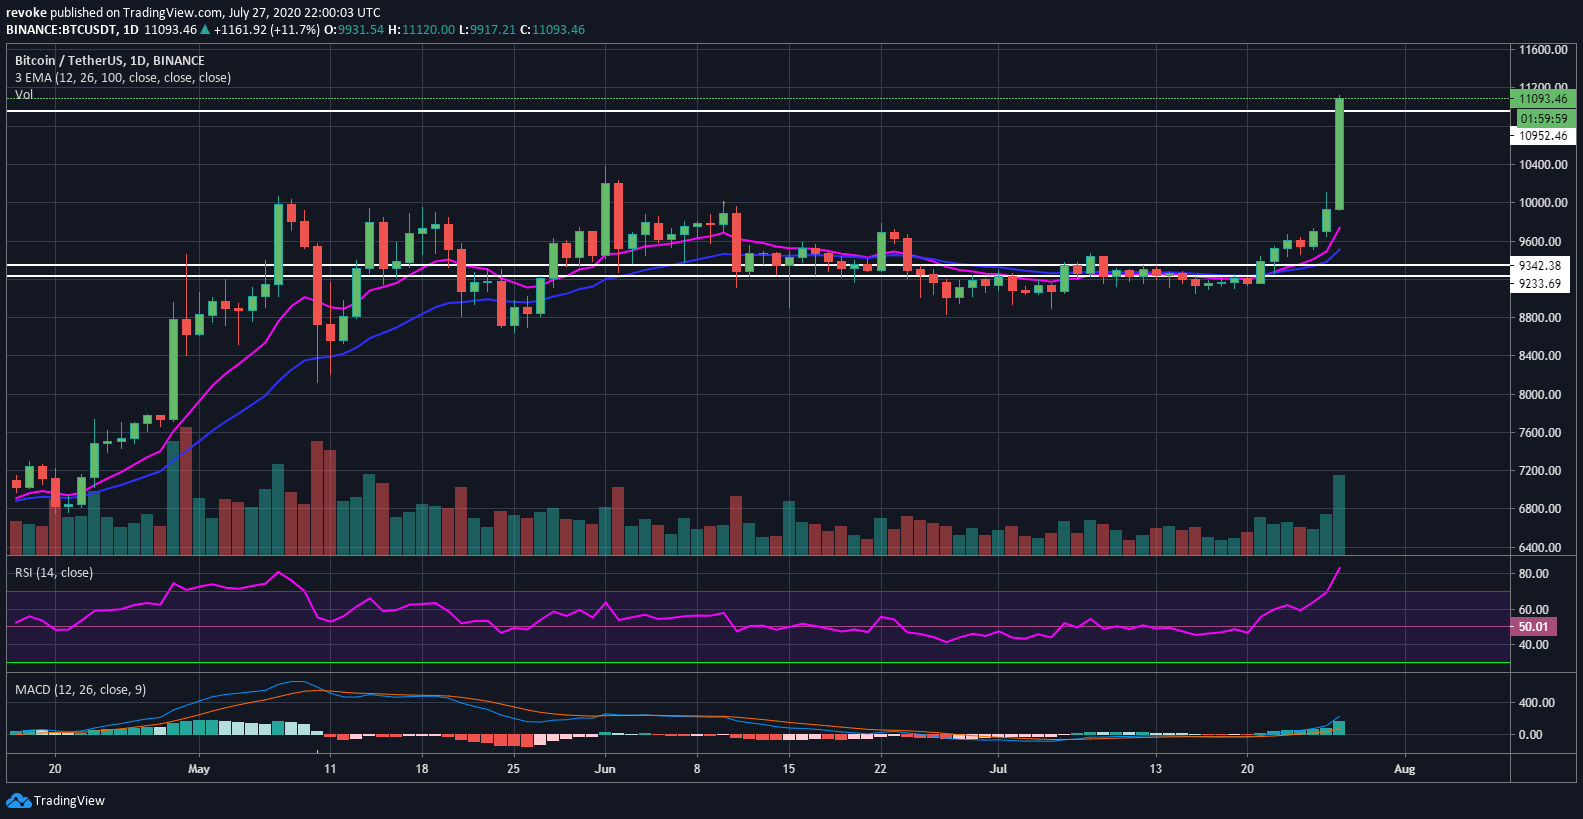
Bitcoin Daily Chart: Strong Bullish Momentum
Obviously, it doesn’t take a genius to see that Bitcoin’s daily chart is massively bullish now after destroying all resistance levels established in 2020 and some. The RSI is above 80 and the MACD is super bullish. Currently, Bitcoin continues trading at $11,104 and could be looking for more.


It’s hard to predict when Bitcoin will stop now as FOMO and strong bullish momentum could continue pushing the digital asset. We know Bitcoin will retrace at some point, we just don’t know when.
Bitcoin Weekly Chart
Let’s take a look at the bigger picture. Bitcoin is now in a confirmed and strong weekly uptrend and the RSI is on the verge of overextension.