MemeCore (M) Under Fire as Onchain Probe Reveals 90% Insider Control
MemeCore (M) faces scrutiny as onchain analysts reveal 90% insider control. Could M follow the $6B collapse of RaveDAO (RAVE)? Read the full deep dive.


MemeCore ($M) has surged into the spotlight, but for all the wrong reasons. While the token’s price action on the daily charts looks like a dream for bulls, a series of onchain investigations have pulled back the curtain on a troubling reality: extreme supply concentration.
Recent reports suggest that over 90% of MemeCore’s supply is held by a tight cluster of insider wallets, creating what experts call a "ghost market cap." This structure mimics the architectural flaws seen in RaveDAO (RAVE), which recently suffered a catastrophic 95% wipeout.
 Crypto taxes made simple: Compare the top-rated tools for 100% compliance and efficiency
What is a "Ghost Market Cap"?
The term "ghost market cap" refers to a project with a multi-billion dollar valuation on paper, but with very little actual liquidity or "free float" (tokens available for the public to trade).
- Valuation: MemeCore currently boasts a market cap north of $5.5 billion.
- The Discrepancy: Despite this massive valuation, its 24-hour trading volume often struggles to stay above $30 million.
- The Risk: When insiders control the vast majority of tokens, they can manipulate the price with relatively small amounts of capital. This allows for artificial "short squeezes" that trap retail traders before the eventual exit.
Will M Price Crash like RaveDAO (RAVE)?
The warning signs for MemeCore are nearly identical to those seen in the RaveDAO (RAVE) collapse. RAVE was touted as a "Live-to-Earn" revolution, surging from $0.25 to nearly $28 in April 2026. However, onchain sleuth ZachXBT revealed that insiders controlled 95% of the supply.
Once the "pump" was exhausted, a single multisig wallet moved millions of tokens to exchanges, causing a liquidity vacuum. RAVE plummeted from its peak to sub-$1 levels in less than 48 hours, wiping out $6 billion in market value. MemeCore’s current structure suggests it is walking the same tightrope.
MemeCore Price Analysis: Is the Rally Sustainable?
Based on the current M/USD price data, the token is showing classic signs of a "low-float" pump.
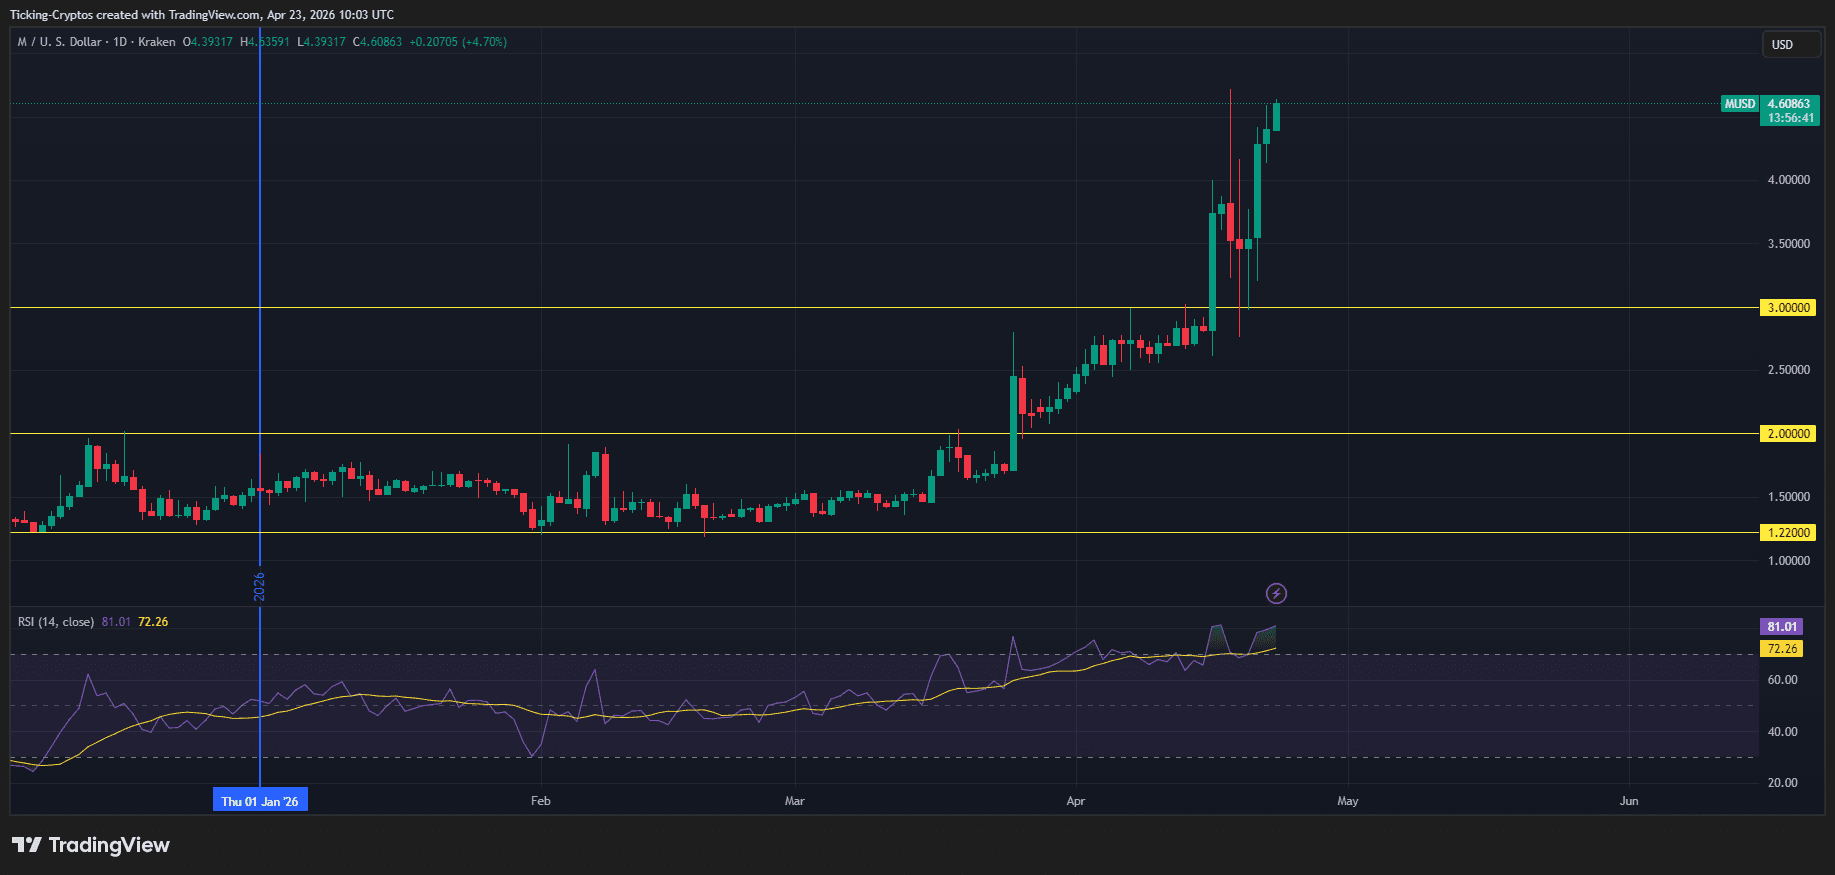
- Parabolic Growth: Since early March 2026, M has climbed from $1.50 to its current levels around $4.60.
- RSI Divergence: The Relative Strength Index (RSI) is currently sitting at 81.01, deep in overbought territory. Historically, an RSI this high without significant volume growth is a precursor to a "blow-off top."
- Support Levels: The yellow lines on the chart indicate critical psychological supports at $3.00 and $2.00. A break below $3.00 could trigger a cascade of liquidations similar to the RAVE event.
Should you Sell MemeCore TODAY?
If you are holding or considering M, these are the "red flag" signals to monitor:
- Wallet Movement: Sudden transfers from top-100 wallets to exchange deposit addresses.
- Liquidity Depth: If the "buy-side" orders on order books begin to thin out while the price stays high, a "liquidity rug" may be incoming.