
Crypto Prices Today: Oil Prices Cap the Bitcoin Rally as Chainlink Slips
Bitcoin trades near $78,600 and the crypto market cap is back above $2.68 trillion, but oil near $100 a barrel is keeping a lid on the September move.





Which topics should we dive deeper into?
Select what genuinely interests you. Your picks feed directly into our editorial planning.
Crypto news that's actually worth your time.
Weekly. 60 seconds. Carefully curated by our editors: no hype, no promo flood, no spam.
The crypto market is consolidating after a strong August rather than breaking down. Bitcoin trades at $78,598, barely changed on the day but up 1.78% on the week, and the market is caught between an August that added almost 25% and a geopolitical risk premium that refuses to fade. Beneath the surface the picture is more divided than the headline number suggests, with Cardano and Chainlink the weakest majors today even though both lead the seven-day board.
What Are the Crypto Prices Today Across the Top Coins?
$Bitcoin trades at $78,598, $Ethereum at $2,491 and XRP at $1.42, with most large caps moving less than 1% over the past 24 hours.
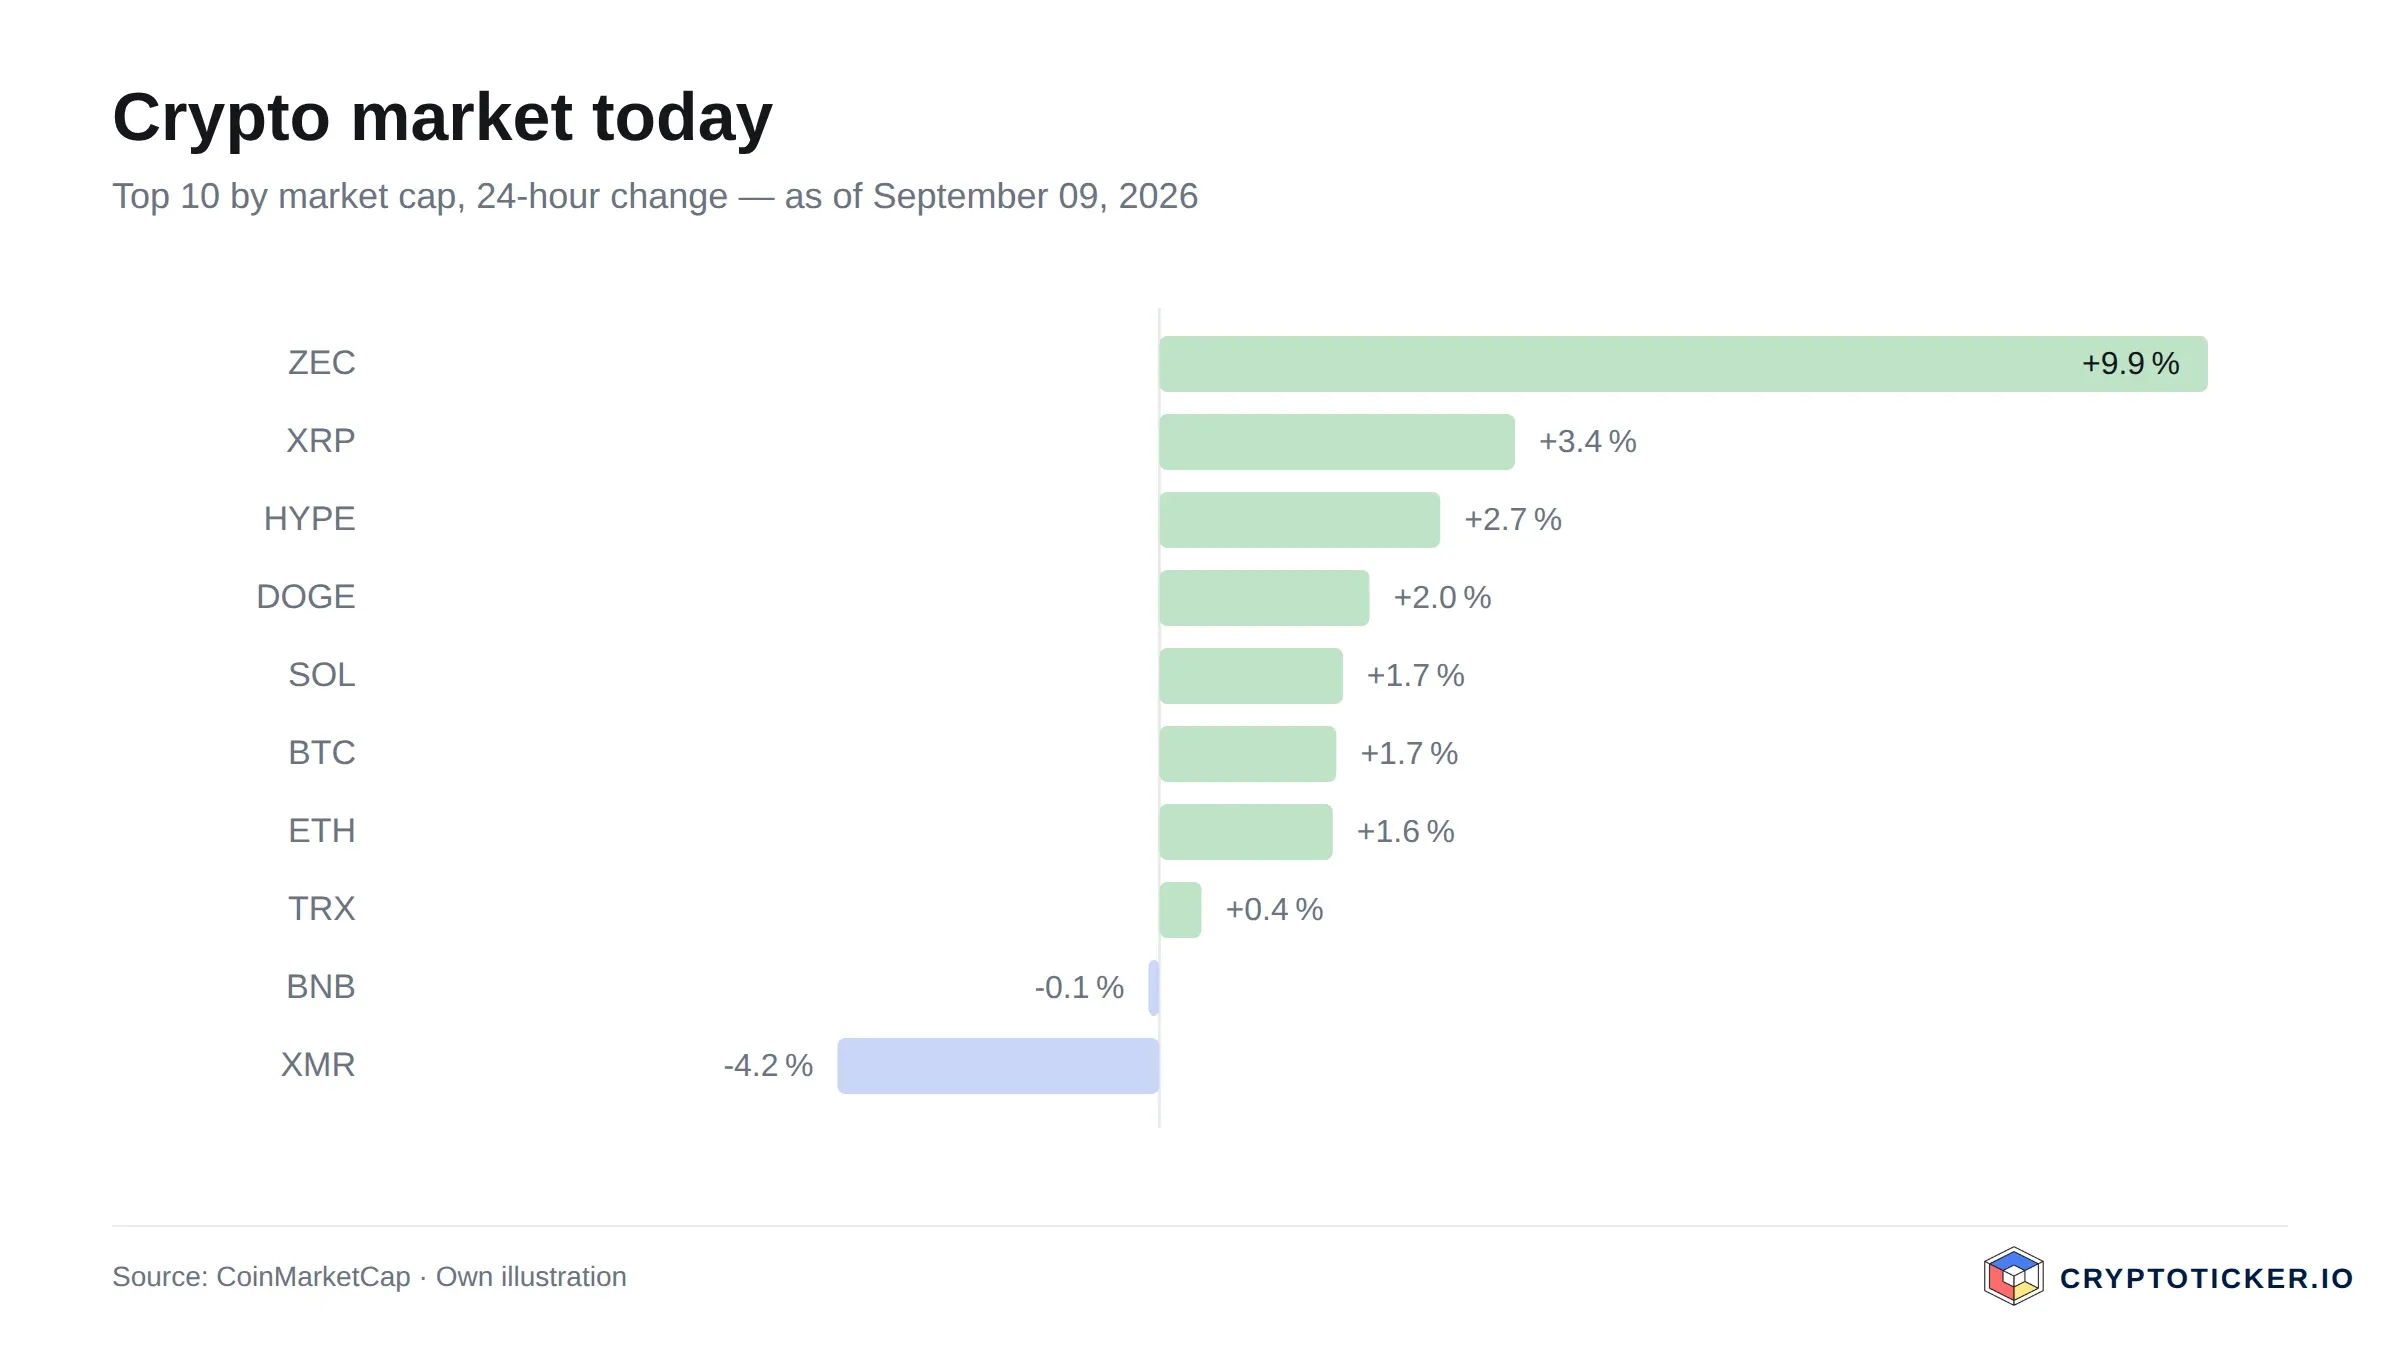
Here are the crypto prices today across the largest non-stablecoin assets:
- Bitcoin ($BTC): $78,598, down 0.31% on the day, up 1.78% on the week. Market cap $1.58 trillion
- Ethereum ($ETH): $2,491, down 0.32% on the day, up 4.36% on the week. Market cap $304.00 billion
- $BNB: $739.20, down 2.20% on the day, up 7.65% on the week. Market cap $98.43 billion
- $XRP: $1.4184, down 0.61% on the day, up 6.31% on the week. Market cap $89.00 billion
- Solana ($SOL): $103.16, down 0.78% on the day, up 4.02% on the week. Market cap $60.48 billion
- TRON ($TRX): $0.3383, down 0.32% on the day, up 4.41% on the week
- Hyperliquid ($HYPE): $85.02, up 1.14% on the day, up 4.14% on the week
- Dogecoin ($DOGE): $0.0890, down 1.70% on the day, up 9.23% on the week
The daily column is flat to slightly negative across the board while the weekly column is green everywhere. That combination is the signal: the market is digesting the August advance, not reversing it.
Where Is the Crypto Market Cap Right Now?
The total crypto market cap sits near $2.68 trillion, down roughly 0.5% over 24 hours, with Bitcoin dominance at 58.89%.
 CoinbaseSponsored
Buy bitcoin on an exchange regulated in the EU
Coinbase is regulated in the EU under MiCA and lists more than 310 cryptocurrencies. Our link gets new customers 15 euros in bitcoin for their first trade. According to the provider the offer runs until 31 December 2026.
Open an account and claim €15 in bitcoin →Crypto is high risk, a total loss is possible. Partner link.
- The crypto market cap has recovered from the trough of this cycle, when Bitcoin traded as low as $58,550 within the last 90 days. It remains well below the peak of about $4.27 trillion set in October 2025, when Bitcoin itself topped out at $126,198.
- bitcoin dominance at 58.89% matters more than the absolute figure. Dominance has risen while the total has recovered, which means the money coming back into the asset class is going into Bitcoin first. Ether accounts for 11.34%. That is a recovery led from the top, not a broad altcoin season.
Daily turnover across the market is $82.07 billion. Volume that modest alongside a flat tape is what consolidation looks like from the inside: nobody is forced to act at these levels.
Which Altcoin Prices Are Moving Against the Market?
Chainlink and Cardano are the sharpest daily fallers at 5.46% and 5.74%, yet both sit at the top of the weekly table, up 8.38% and 10.20%.
Not all altcoin prices are moving together, and the split runs along the time frame rather than along the coins:
- Chainlink (LINK): $12.00, down 5.46% on the day but up 8.38% over seven days. The daily drop gives back part of a strong week
- Cardano (ADA): $0.2160, down 5.74% on the day and the best weekly performer among the majors at plus 10.20%
- Dogecoin ($DOGE): $0.0890, down 1.70% on the day, up 9.23% on the week
The pattern is the same in each case: a strong week, a soft day. That is profit-taking inside an uptrend rather than distribution, and it is the opposite of what the market looked like in mid-August, when weekly columns were red and daily moves were flat.
Hyperliquid is the exception on the daily board, up 1.14% at $85.02, and it is the only major in the group holding a gain over both time frames.

What Does the Crypto Fear and Greed Index Show?
The Crypto Fear and Greed Index reads 72, which places sentiment in greed territory for the first time in months.
A reading of 72 on the crypto fear and greed index means risk appetite is switched back on. The contrast with the middle of August is the whole story: the same index read 29 then, and the deepest point of this cycle was 10 on 5 February 2026, with Bitcoin at $63,548.50 at the time. Sentiment spent most of the first half of 2026 in fear and has now crossed to the other side.
Greed readings are a warning as well as a confirmation. They tend to appear after a move, not before it, and they mark the point at which late buyers arrive. The index is a measure of positioning, not a forecast.
Why Is the Bitcoin Price Stalling This Week?
Renewed fighting between the United States and Iran has pushed oil back toward $100 a barrel, and that revives the inflation question one week before the Federal Reserve meets.
The bitcoin price is not falling, it is refusing to extend. August delivered a gain of almost 25%, and the market has since traded in a narrowing range. The reason is macro rather than crypto-specific: an oil price near triple digits feeds directly into headline inflation, and a Fed that has to weigh higher energy costs is a Fed less likely to cut. Crypto has traded as a rate-sensitive asset all year.
Flows tell the other half. US spot Bitcoin ETFs took in $3.52 billion over the course of August, so the institutional bid that was absent in the spring came back during the rally. What has not happened yet is a follow-through in September.
What Do the Technicals Say About the Bitcoin Price?
Bitcoin trades above its 20-day, 50-day and 200-day exponential moving averages, with daily RSI near 63 and the 30-day range running from $62,830 to $81,272.
The structure has flipped since mid-August. Price at roughly $78,600 sits above the EMA20 at $76,733, the EMA50 at $72,031 and the EMA200 at $72,916. Each of those levels is now support instead of resistance, and the EMA200 in particular is the line that separated the downtrend from the current phase.
Daily RSI14 near 63 is firm without being stretched. Readings above 70 are where a market starts to look short-term overbought, so there is room left, but the easy part of the move is behind rather than ahead.
The 30-day high at $81,272 is the level that matters on the upside. On the downside, the EMA20 near $76,733 is the first line worth watching, and a loss of the EMA200 near $72,916 would be the signal that the August advance is being given back rather than digested.
What Should Crypto Investors Watch Next?
Two questions decide the next leg, and both sit outside the crypto market.
- The oil price. As long as crude trades near $100 a barrel, the inflation path stays uncomfortable and the case for rate cuts weakens. A retreat in oil would remove the main brake on this market.
- The Federal Reserve. The next rate decision lands in roughly one week. Crypto has followed the rate expectation curve for the whole of 2026, and there is no reason to expect that link to break now.
Until one of those two resolves, the range-bound pattern is the most likely continuation. The difference to mid-August is that the range now sits above the long-term moving averages instead of below them, and that is a materially better starting position.
Frequently asked questions about crypto prices after the August 2026 rally
More on Bitcoin: All Bitcoin news at a glance
Related articles
- Why Is the Crypto Market Flat Today? November 6, 2025
- After Bitcoin Crash, Will Altcoins Gains Reach 500%?
- Crypto Market Up: Bitcoin Breaches $71K, Altcoins Follow Suit, Eyes on New Highs
- Crypto News Today: Bitcoin, Ethereum, and XRP Extend Gains for a Fifth Day
- Bitcoin Price Prediction: Can BTC Price Fall Below 50K?
Which topics should we dive deeper into?
Select what genuinely interests you. Your picks feed directly into our editorial planning.
Crypto news that's actually worth your time.
Weekly. 60 seconds. Carefully curated by our editors: no hype, no promo flood, no spam.

November 21, 2024 11:50 AM
Bitcoin Price Is 2% Away From $100,000: Is Today THE DAY?
With almost 2% away from breaking the Bitcoin $100,000 price mark, a historic milestone for the crypto market. Could Today be The Day?
June 9, 2026 6:39 PM

Crypto Market Crash Deepens as Stocks, Gold, and Bitcoin Sell Off Together
Crypto market crash deepens as Bitcoin, stocks, gold, silver, and oil fall together. Is this panic selling or a deeper market reset?
September 27, 2026 11:28 AM

Crypto Prices Today: Bitcoin Holds $84,000 After Its Best Week Since January
Bitcoin at $84,600, ETH at $2,700, NEAR up 56 percent on the week. Crypto prices today, what drove the rally, and what could move the market next.
June 14, 2026 12:24 PM

Is Bitcoin Near a Bottom? BTC Enters Deep Bear-Market Valuation Zone
Bitcoin sits in a deep bear-market valuation zone with fear near record lows. Here's what on-chain data says about a bottom — and what could decide it.
December 24, 2025 5:30 PM

Crypto Market Analysis: Top 10 Cryptos Go Sideways During Christmas
Crypto prices remain largely flat as Bitcoin, Ethereum, and altcoins drift sideways during the Christmas holidays and low trading activity.
May 15, 2026 9:47 AM

Top 10 Altcoins to Buy in May 2026 as Bitcoin Recovers
Here are the top 10 altcoins to buy in May 2026 as Bitcoin rebounds near $80K and market momentum shifts.
August 16, 2026 9:05 AM

Crypto Weekly Recap: Bitcoin Slips Below $63,000 as CPI Relief Never Arrives
Bitcoin sits near $62,990 and down 2.7% on the week, ETF flows turned negative and XRP broke $1. Your Sunday crypto recap.
April 20, 2024 4:07 PM

What Happened To Cryptos After Bitcoin (BTC) Halving Today?
Today's cryptocurrency market highlights: Bitcoin over $64k and Ethereum towards $3,1k. But what about altcoins?
July 27, 2024 2:34 PM

Why Is The Crypto Market Up TODAY?
With the Bitcoin 2024 Conference taking place now in Nashville, the crypto market is showing bullish signals, intriguing traders around the future of Bitcoin and Altcoins.
June 18, 2026 7:03 PM

Bitcoin Got the Wrong Crash: Oil Fell, But Crypto Took the Hit
Oil crashed after peace headlines, a move that should have helped Bitcoin. Instead, BTC fell below $63K, ETH dropped under $1,700, and crypto longs were wiped out.
January 8, 2026 6:16 AM

Crypto Crash of 8 January 2026: The Top 5 Altcoin Losers as Bitcoin Slipped to $90,000, and Where They Are Now
On 8 January 2026 Story, Pump.fun, Virtuals, Zcash and Dash led the losers as Bitcoin slipped to $90,000. Nine months later Zcash and Dash are among the winners of the year.
August 12, 2026 4:55 PM
Crypto Prices Today: Only 2 of the Top 10 Coins Are Up in 2026
Bitcoin sits near $63,433 and TRON and Hyperliquid are the only green names on the year. Here are today's prices and the next catalysts.
August 25, 2026 3:56 PM

Bitcoin Price Cracks $80,000 Then Cools While Altcoins Push Higher
Bitcoin cleared 80,000 dollars for the first time since May, then slipped to 79,100. Chart analysis, upside targets and key support levels.
July 15, 2024 11:02 AM

Bitcoin Price Prediction: BTC Price Surge STARTING or ENDING?
Amid the current market rally, all eyes are on Bitcoin price, especially following the attack on one of its most strategic supporters. With the current BTC price surge, here are the predictions of how high and for how long.
March 25, 2026 4:24 PM

Markets Are Pricing Peace — But Crypto Is Sending a Different Signal
Bitcoin holds $70K as markets rally on Iran ceasefire hopes, but weak altcoins signal caution. Is crypto doubting the peace narrative?
July 14, 2026 9:55 AM

Bitcoin Price Stuck at $60K: 3 Events This Week Could Unlock the Next Big Move
Bitcoin is pinned to the $60K line as Extreme Fear grips the market. But three catalysts landing over the next 48 hours could finally shake crypto out of its deadlock — here's what to watch.
September 7, 2025 10:50 AM

Top 3 Altcoins to Buy in September 2025
The crypto market is at a standstill, but Bitcoin’s stability and an Altcoin Season Index signals opportunities. Here are the top 3 altcoins to buy now.
July 8, 2026 6:22 PM

Why Is Crypto Crashing Today: US Strikes on Iran and a Collapsing Ceasefire
Fresh US airstrikes on Iran and a ceasefire declared "over" sent crypto into the red today. Here's why Bitcoin, Ethereum and altcoins are bleeding.
May 30, 2026 6:16 PM
Crypto Prices Today: Bitcoin Holds $73K Amid Institutional De-Risking While Altcoins Struggle
Bitcoin trades near $73,500 while major altcoins steady. High Treasury yields and ETF outflows spark caution ahead of a pivotal macro week.
October 8, 2026 5:06 PM

Crypto Crash Reason: Why Bitcoin Fell Below $81,000 and Altcoins Bled Even Harder
Bitcoin slid under $81,000 and Ethereum lost 9% in a week. Here is every crypto crash reason behind the October 2026 selloff explained.
May 19, 2026 10:00 AM

Crypto Market Reversal: Why Altcoins Are Turning Green While Bitcoin Stays Flat
Crypto market reversal begins as altcoins recover faster than Bitcoin, but BTC remains flat near $77K amid macro and geopolitical uncertainty.

May 12, 2026 3:51 PM

Bitcoin Holds $80,000 as XRP Outpaces Market Amid ETF Surge
Bitcoin maintains its $80,000 support while XRP breaks key resistance. Discover how institutional ETF inflows and market shifts are driving crypto prices today.
July 28, 2025 9:27 AM

Trump–EU Trade War is OVER: What It Means for Bitcoin and Altcoins
President Trump just struck a $1.3 trillion trade framework with the EU, aimed at stability, zero tariffs, and massive energy deals. Here’s how this could shape Bitcoin’s next move.
March 31, 2026 7:57 PM

What Threat Could Crash the Crypto Market? War-End Rally Faces Hidden Risk
Crypto markets surge on war-end hopes, but threats to US companies and rising oil prices could trigger a sudden crash.
February 28, 2026 2:54 PM

5 Cryptos That Lost the Most during the Iran War
Rising Middle East tensions rattle markets as five major cryptos post double-digit 24h losses amid global risk-off sentiment.


More from CryptoTicker