Chainlink Price Prediction: LINK ready to climb higher after defending critical level
Chainlink broke out of an ascending triangle pattern on the daily chart on October 22. The usual price action after these types of breakout is for the digital asset’s price to re-test the previous resistance level as a support point. […]

Chainlink broke out of an ascending triangle pattern on the daily chart on October 22. The usual price action after these types of breakout is for the digital asset’s price to re-test the previous resistance level as a support point.
LINK/USD Daily Chart – TradingView
LINK re-tested the previous 11.32 resistance level on three occasions, including today. So far, it seems that the bulls have managed to defend it. Bitcoin had a great day today, jumping by 2% and turning the entire market bullish again.
Bulls need to recover the 100-SMA as a support level and then break the last high at $12.95 to continue with the daily uptrend and confirm the breakout of the triangle pattern. The only bearish indicator on the daily chart is the MACD which is on the verge of turning bearish for the first time since September 25.
Chainlink Price Analysis: On-Chain Metrics
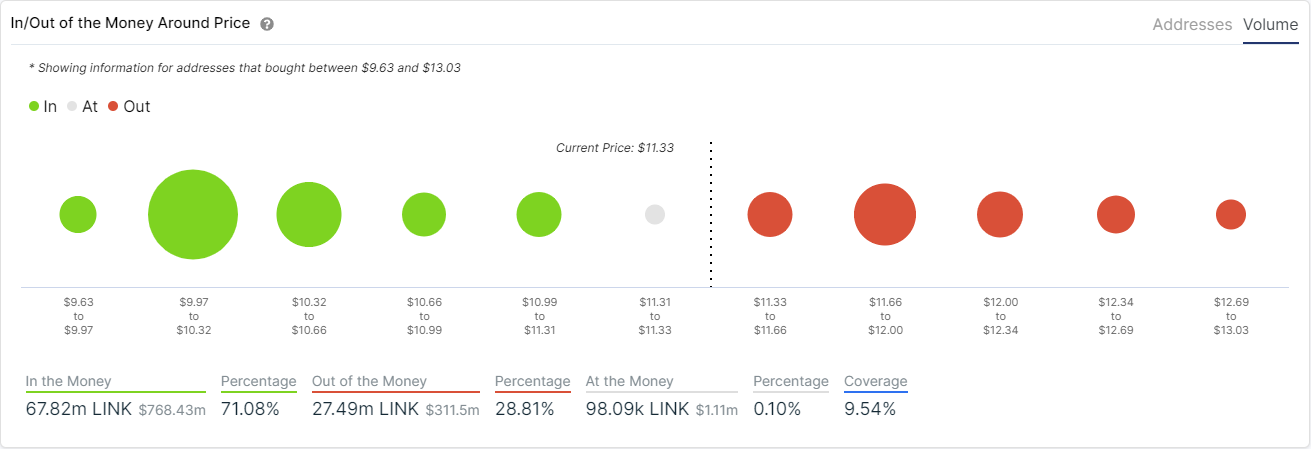
The IOMAP chart shows only one relatively strong resistance area between $11.66 and $12. In this range, more than 9,000 addresses bought close to 14 million LINK coins. This metric shows how many investors might want to cash out after their break-even point.

As for support, it seems that the most interesting area is $9.97-10.32. In comparison, LINK has more support than resistance ahead.

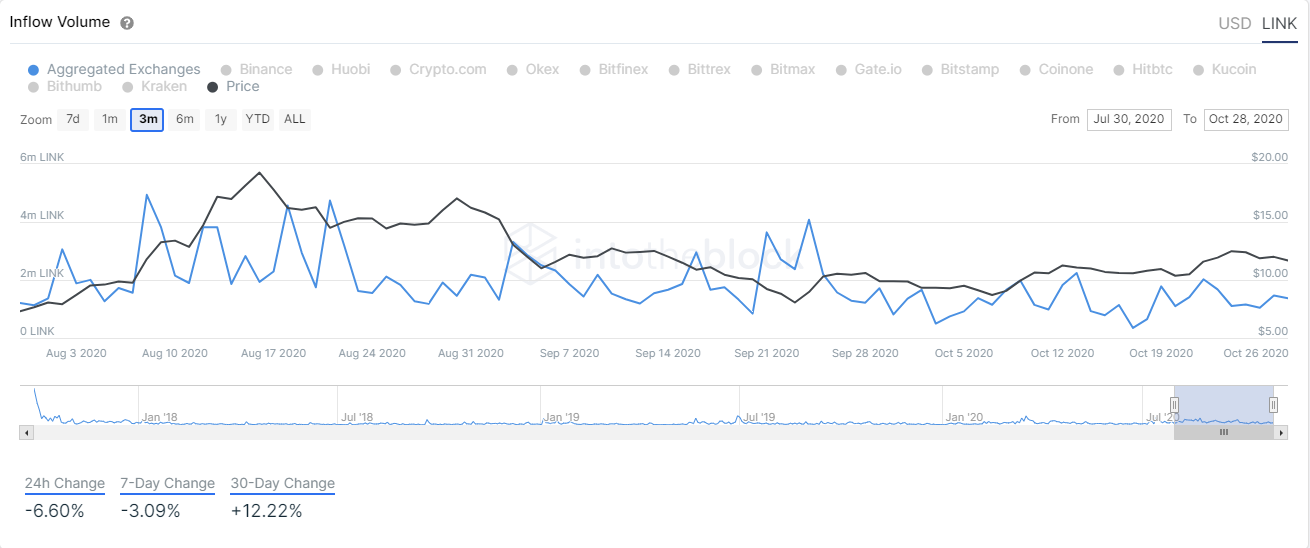
Exchange inflow volume of LINK has been going down in the past 7 days, indicating that some of the selling pressure we have seen during the middle of August, is fading away.
Chainlink Technical Analysis
Exploring shorter time-frames like the 4-hour chart, we can observe the 100-SMA acting as a robust support level at $11.30. So far, the moving average has supported the price of LINK six times in the past 24 hours.
LINK/USD 4-Hour Chart – TradingView
A bearish breakout from this point can easily drive the price of Chainlink towards the lower trendline of the ascending triangle. On the way up, the 50-SMA will act as a resistance level at $11.87, which coincides with what the IOMAP chart says.
Bears have confirmed a downtrend on the 4-hour chart and the MACD remains bearish since October 25. The RSI is at 41 and getting dangerously close to oversold conditions. Bulls need to establish a higher low compared to $11.08 and then a higher high above $11.81 to confirm an uptrend.


