LINK Price Jumps to $11.5 After Strong Rebound
Chainlink is currently trading at $11.6 after a robust rebound from a low at $7.28. The digital asset had an amazing 2020, climbing to an all-time high of $20 on August 16. LINK price suffered a 64% correction months later, […]


Chainlink is currently trading at $11.6 after a robust rebound from a low at $7.28. The digital asset had an amazing 2020, climbing to an all-time high of $20 on August 16. LINK price suffered a 64% correction months later, something quite expected considering the magnitude of the bull rally.
The first low was established on September 23 at $7.28 and after a decent bounce, the bulls have set a new higher low at $8.4 straight into a higher high confirming a daily uptrend for the first time since LINK hit its all-time high.
Chainlink Price Analysis
On the daily chart, the price just climbed above the 50-SMA and the 100-SMA. A close above both of these levels will cement the bullish momentum of LINK in the short-term. The next critical resistance level is located at $12.79.
LINK/USD daily chart – TradingView
Considering the trading volume has been increasing over the past week, following the rise of LINK, bulls are quite confident. A breakout above $12.79 can take LINK up to $18 and potentially towards the $20 for a re-test.
LINK/USD Weekly Chart – TradingView
On the weekly chart, after confirming a daily uptrend, the price of LINK has established a higher low at $7.28. The space between the higher low and the high is close to $13, which means the most likely scenario will be establishing a lower high below $20, into another higher low, creating an equilibrium pattern.
However, because the entire crypto market is turning really bullish again, there is a chance that LINK will simply climb above $20 in one go, continuing with the robust weekly uptrend. The price has just climbed above the 12-EMA for the first time since September 14 and has kept defending the 26-EMA, several weeks in a row.
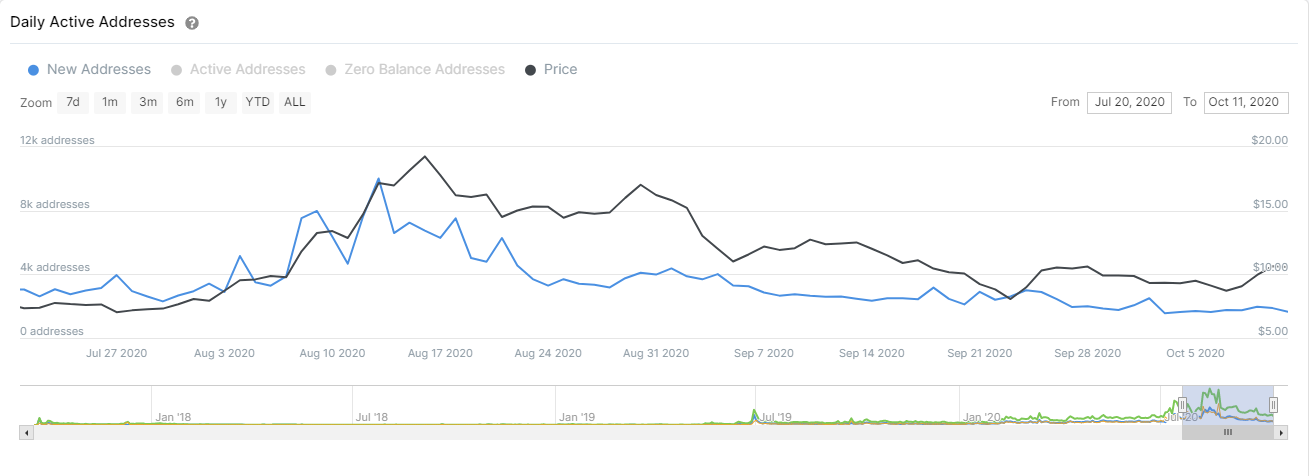
Interestingly, the number of new addresses joining the Chainlink network is not increasing. According to data provided by IntoTheBlock, this metric started a downtrend on August 13 that has continued until the present.