BNB Price Explodes to $40 Establishing a New All-Time High
BNB price hit $39.9999 on December 29 which is a new all-time high. The digital asset was unable to crack $40 but remains trading at $37.5 after a slight pullback. Binance Coin seems to be one of the few altcoins […]


BNB price hit $39.9999 on December 29 which is a new all-time high. The digital asset was unable to crack $40 but remains trading at $37.5 after a slight pullback. Binance Coin seems to be one of the few altcoins that is trying to outperform Bitcoin alongside Ethereum.
BNB faces very little resistance to the upside as these levels haven’t been seen since June 2019. Several on-chain metrics suggest the digital asset is ready for even more growth in the near future.
BNB Price Analysis: Whales are accumulating Binance Coins
One of the most critical on-chain metrics is the BNB Holders Distribution which clearly shows large holders are still accumulating the coin. The number of whales holding between 100,000 and 1,000,000 ($3,700,000 and $37,000,000) BNB coins has grown by 8 since the beginning of September.
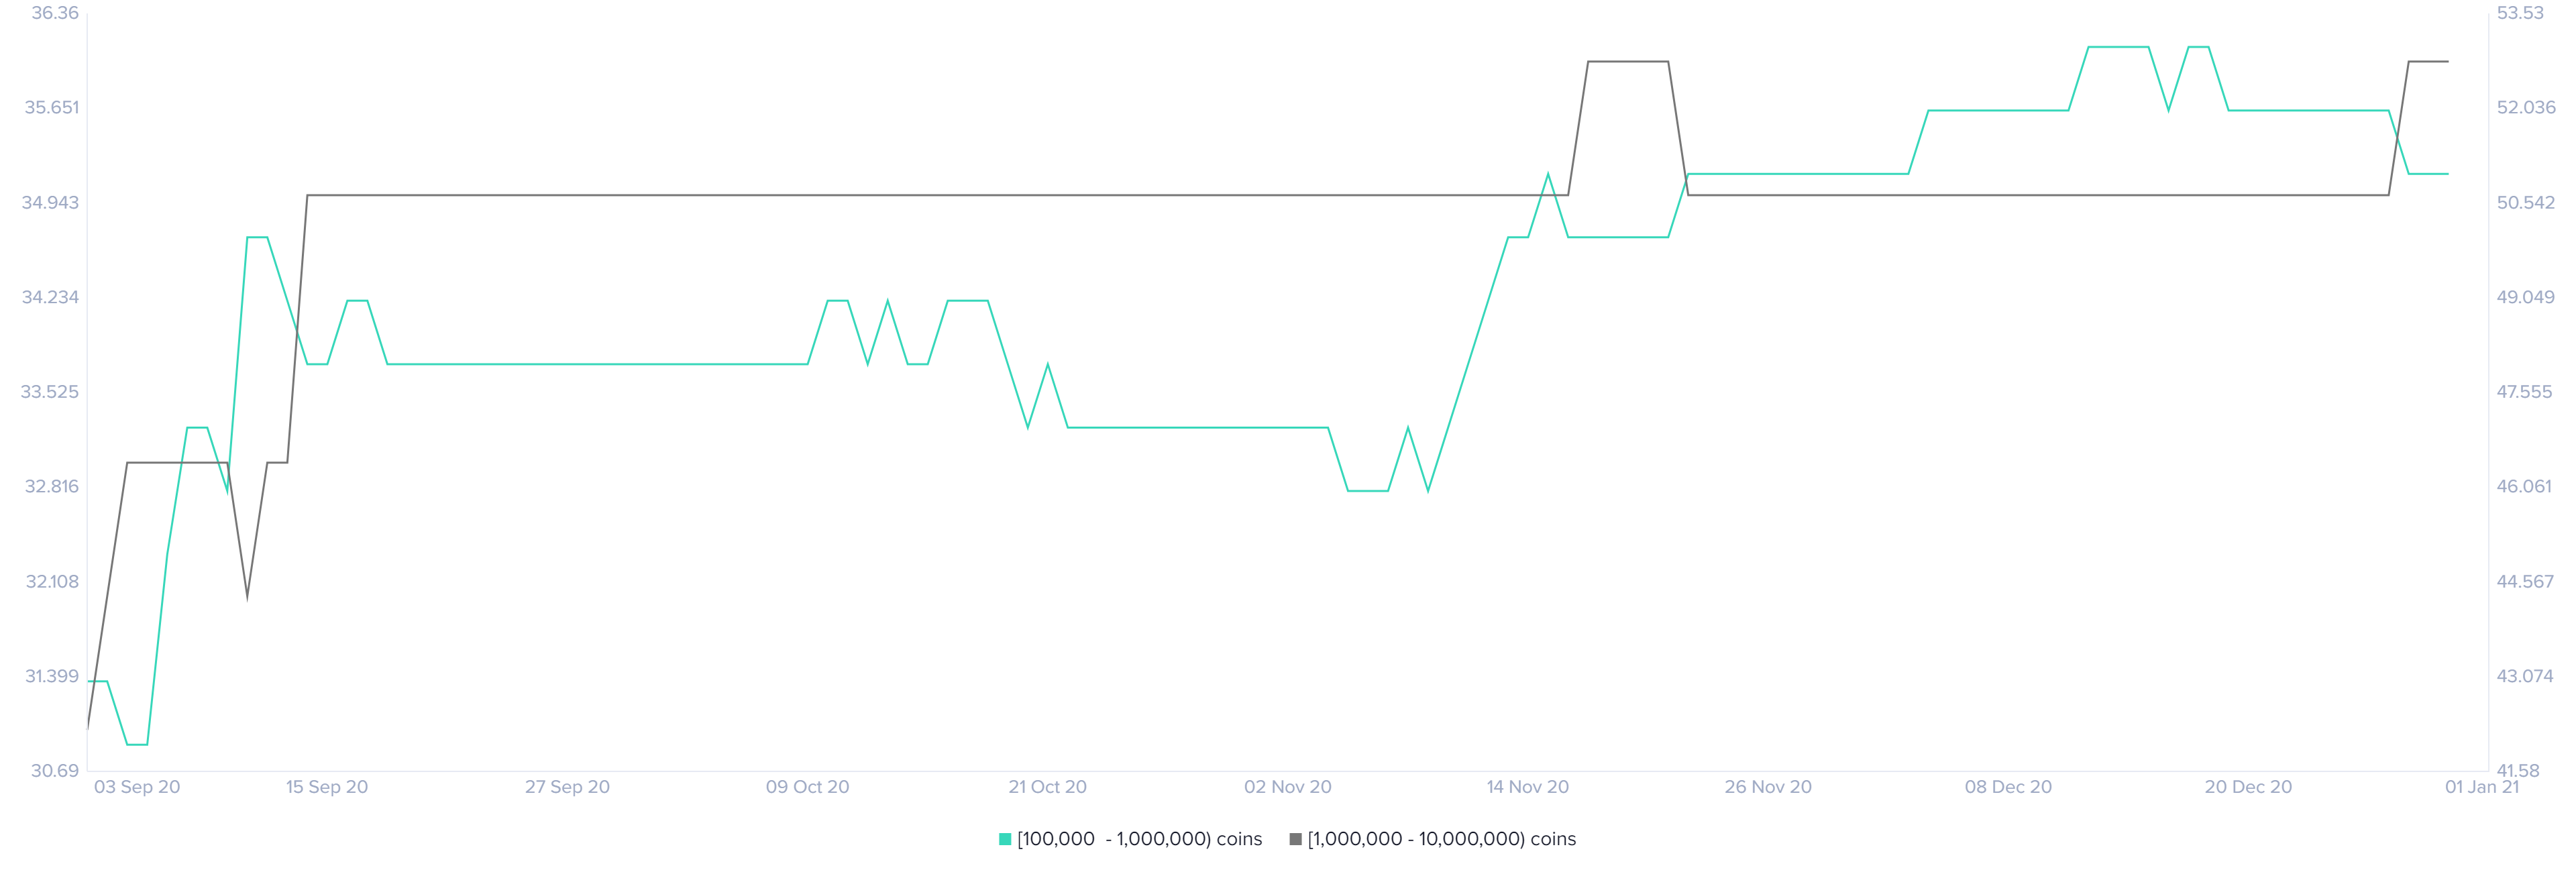
Similarly, whales with 1,000,000 – 10,000,000 ($37,000,000 – $370,000,000) BNB coins also increased by 5. This is significant given the fact that we could be easily talking to more than $1 billion in BNB accumulated over the past three months.
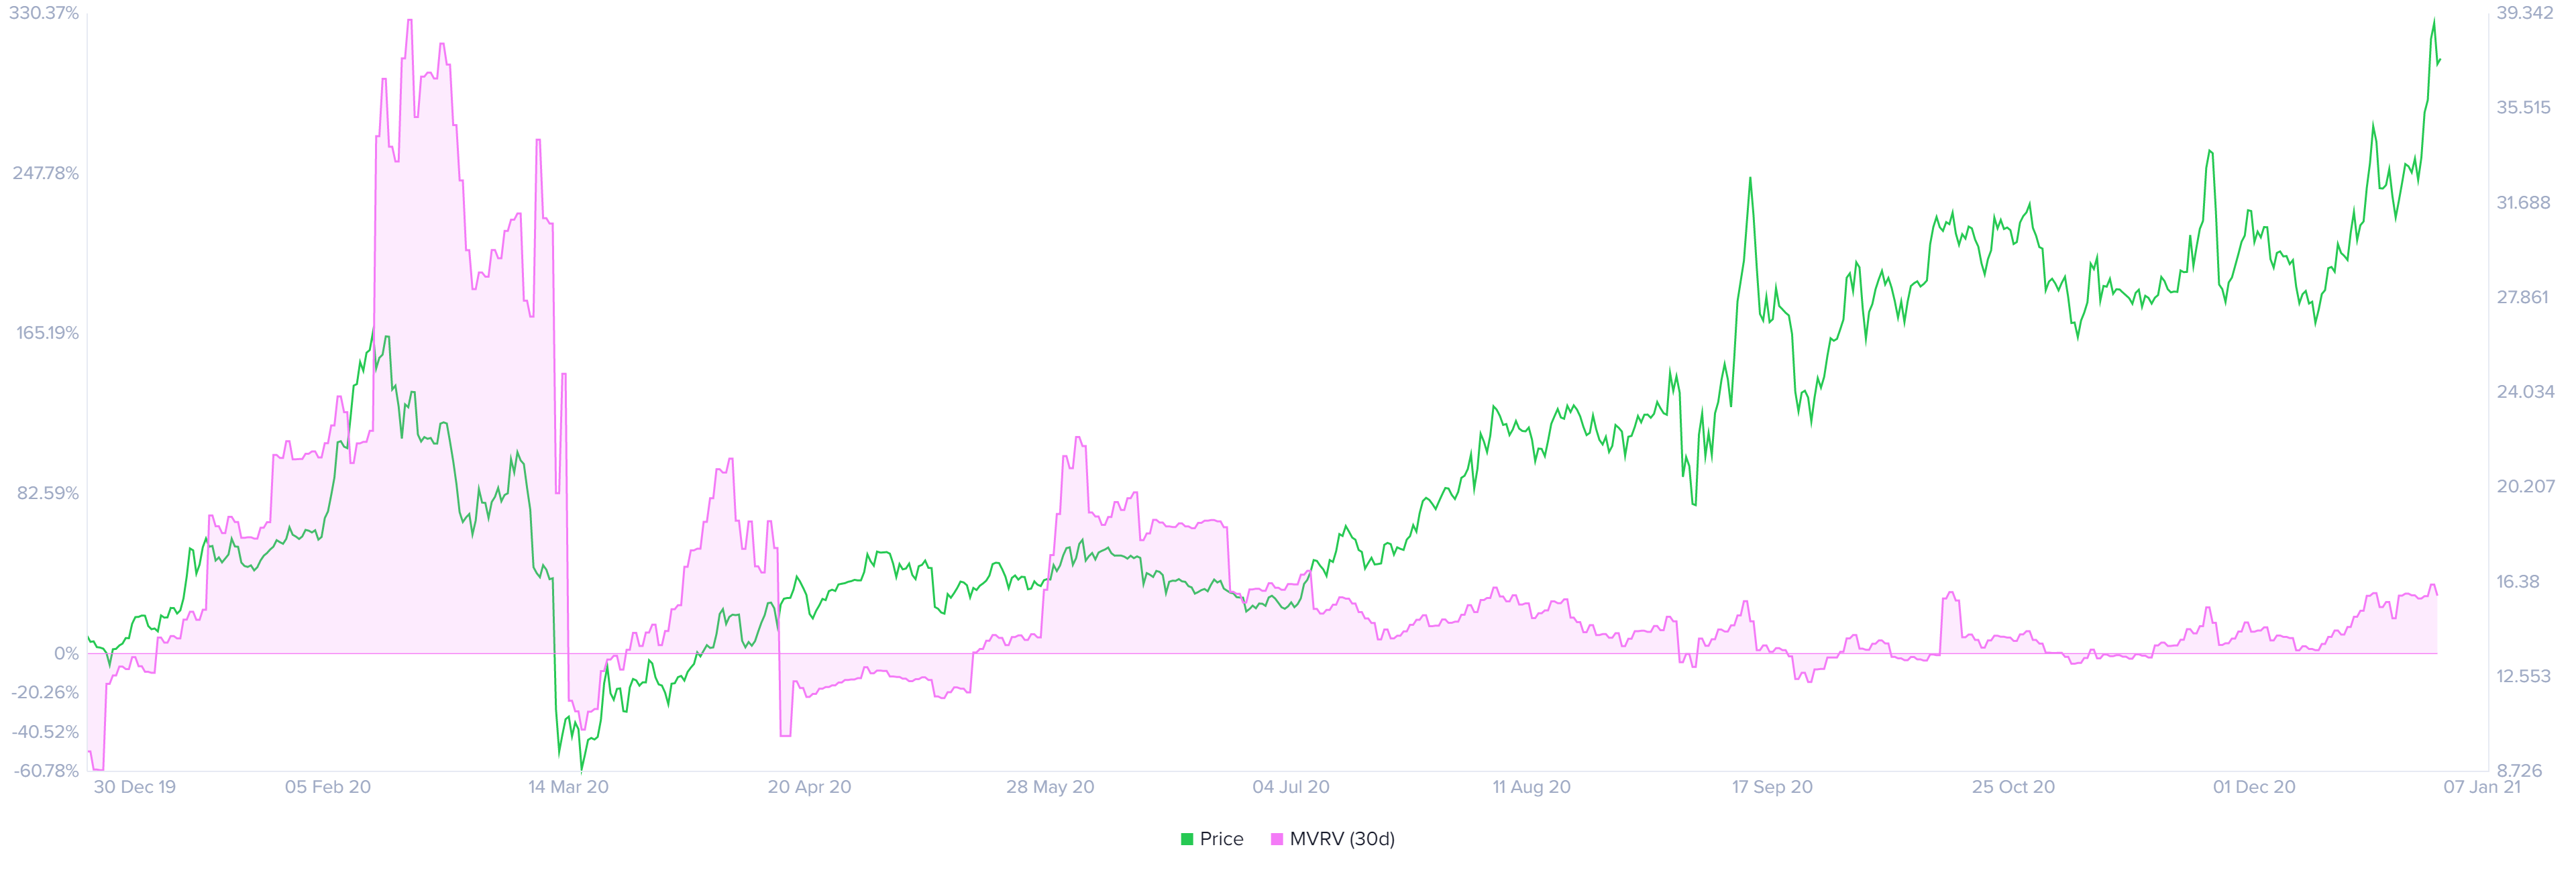
The MVRV metric which shows the average profit or loss of BNB holders remains quite low, especially when compared to February 2020. This is considered positive as it means BNB price is not at risk of a major correction despite the recent increase in price.
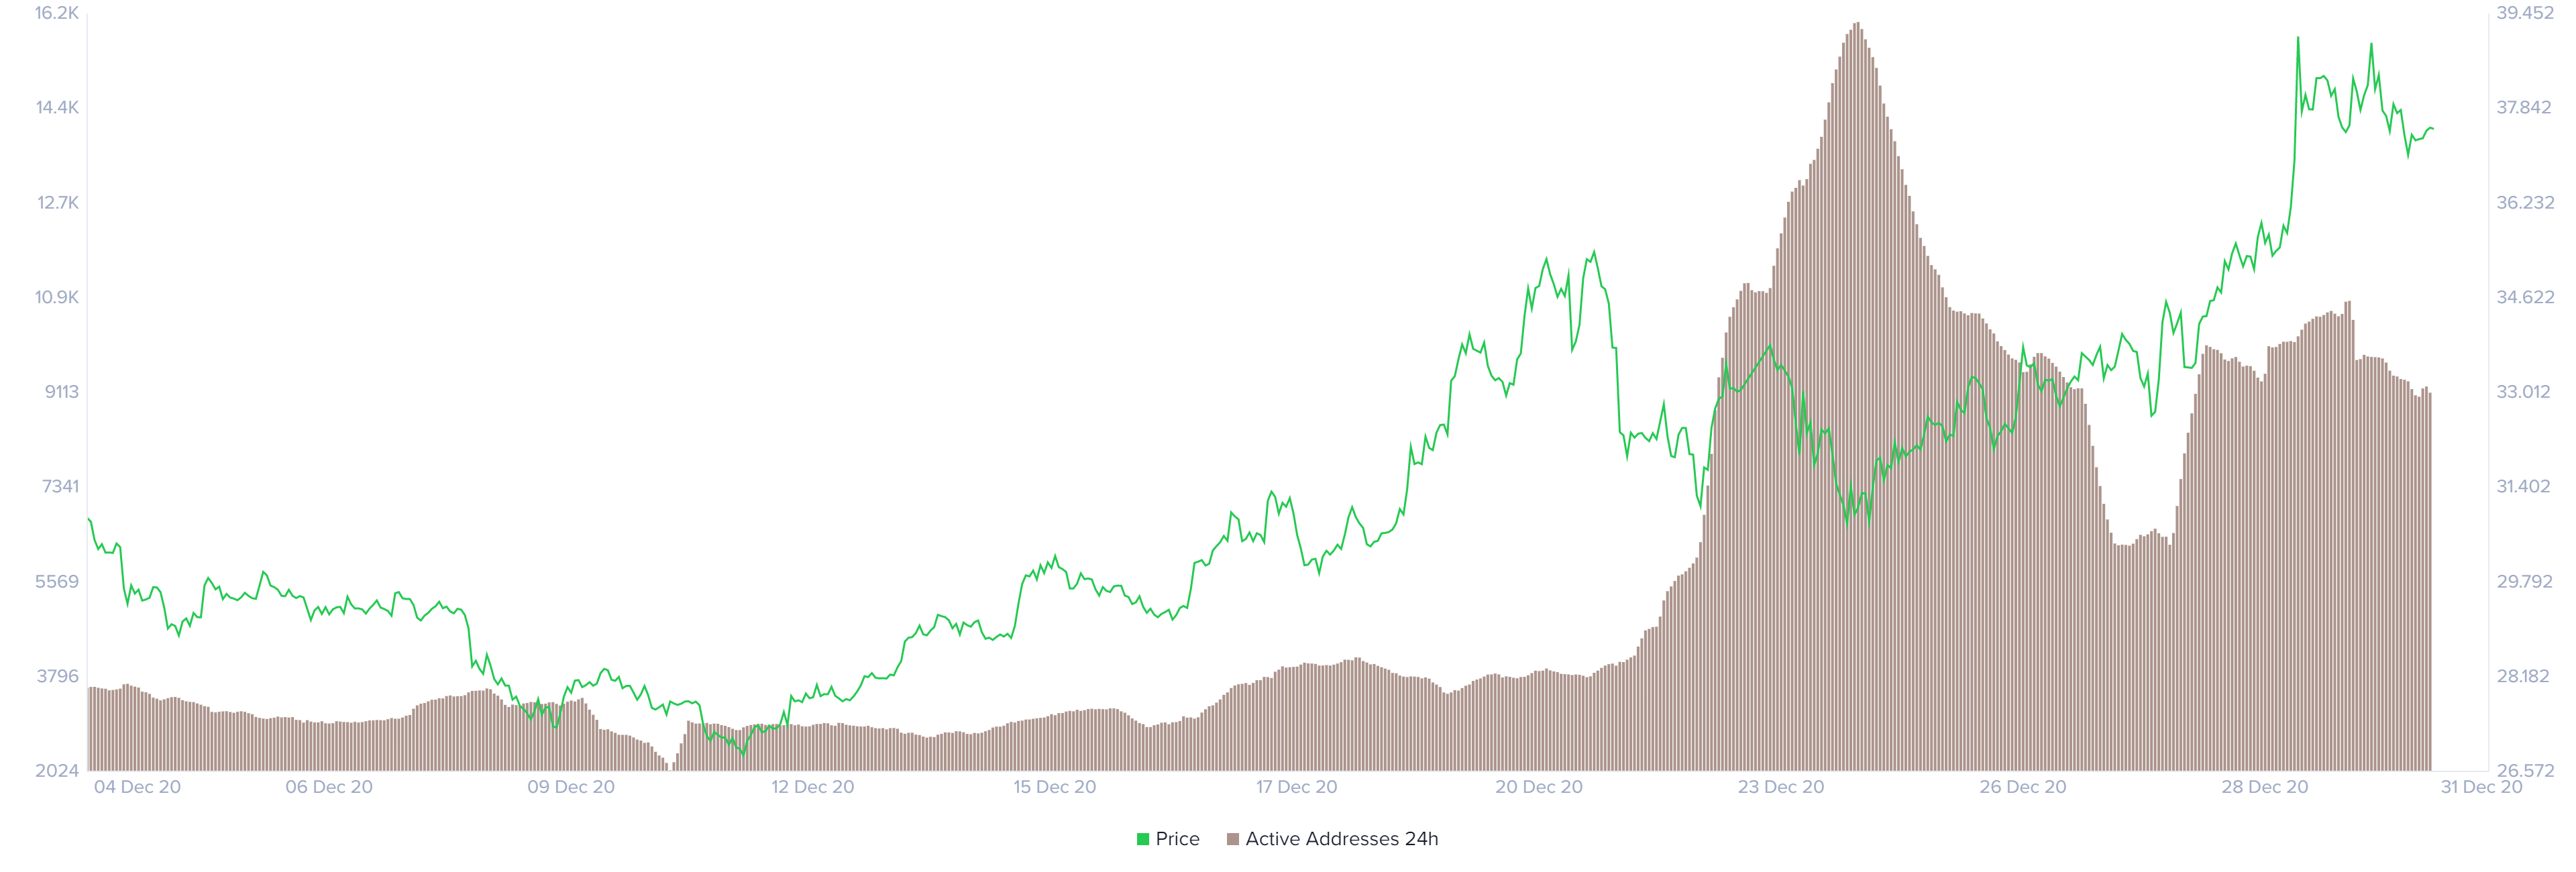
Additionally, the number of active addresses has spiked significantly since December 22 which indicates a lot of interaction with BNB.
On the 12-hour chart, BNB price had a slight pullback down to $36.81 but this should be considered healthy as the digital asset has seen a 33% rally in the past week. The two most important support levels are the 12-EMA and the 26-EMA.
BNB/USD 12-hour chart – TradingView
The 12-EMA was lost a few times during the past rally. However, the 26-EMA has acted as a robust support level and an accurate indicator of when to buy the dips. The RSI was overextended and has cooled off a little, but remains at risk of overextension again.
It seems that a weak bearish divergence between the RSI and the price has formed on the 12-hour chart as BNB price formed higher highs but the RSI formed a double top. This is considered quite weak, but it’s important to keep track of it.
Follow CryptoTicker on Twitter and Telegram for daily crypto news and price analyses!