Yearn.Finance Price Prediction: YFI is on the verge of a 20% breakout
Yearn.Finance price is currently at $28,520 bounded inside a symmetrical triangle pattern formed on the 1-hour chart. The digital asset is still in a retracement period since its high on December 2 at $31,780. Both bulls and bears see different […]


Yearn.Finance price is currently at $28,520 bounded inside a symmetrical triangle pattern formed on the 1-hour chart. The digital asset is still in a retracement period since its high on December 2 at $31,780.
Both bulls and bears see different indicators to support their cause. Let’s dive into the most important technical and on-chain metrics.
Yearn.Finance Price Analysis: Technical Indicators
The most critical pattern is the symmetrical triangle formed on the 1-hour chart. The MACD has just turned bullish for the first time since December 3 and YFI price is just climbing above the 12-EMA and now trying to crack the 26-EMA.
YFI/USD 1-hour chart – TradingView
If bulls can turn both moving averages into support levels, the odds of a breakout will be much higher. Using the height of the pattern as a reference, bulls are targeting $34,691 in the long-term after a breakout.
On the other hand, bears need to keep the 26-EMA as a resistance level and push Yearn.Finance price below the 12-EMA to shift the odds in their favor. A breakdown below the lower trendline of the pattern can quickly push YFI price towards $22,060, a 20% pullback.
However, it’s important to note that most technicals are highly in favor of the bulls on the 1-hour, 4-hour, daily, and weekly charts.
Yearn.Finance Price Analysis: On-Chain Metrics
The In/Out of the Money Around Price chart practically shows no resistance to the upside besides the range between $29,510 and $30,360. This area would be above the upper trendline fo the symmetrical triangle pattern which means it won’t pose much of a risk for the bulls.
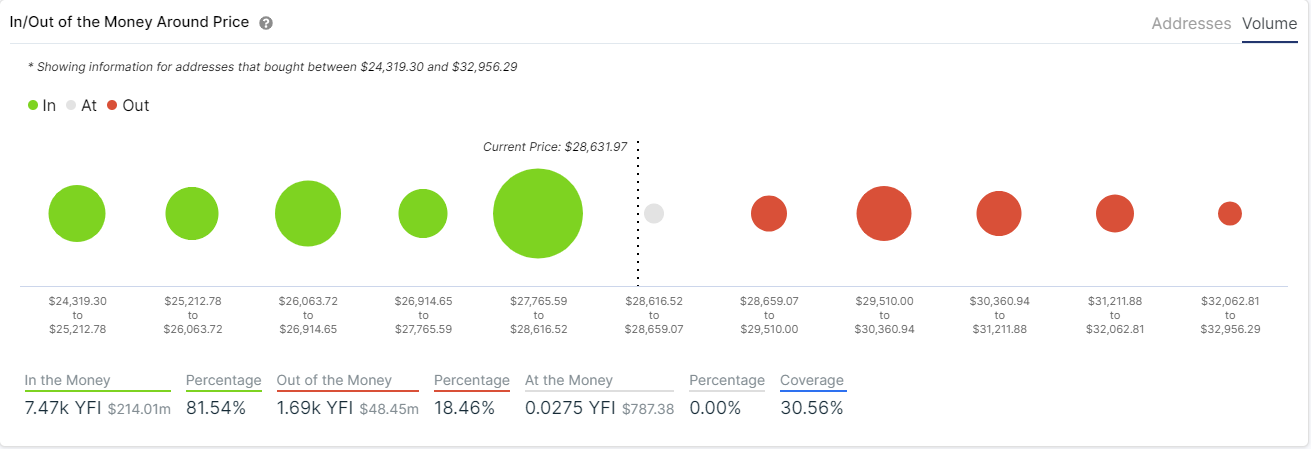
A breakout above $30,360 seems to indicate that Yearn.Finance price can quickly climb towards $33,000 according to the IOMAP chart. We can also see a lot more support on the way down starting at $28,616.
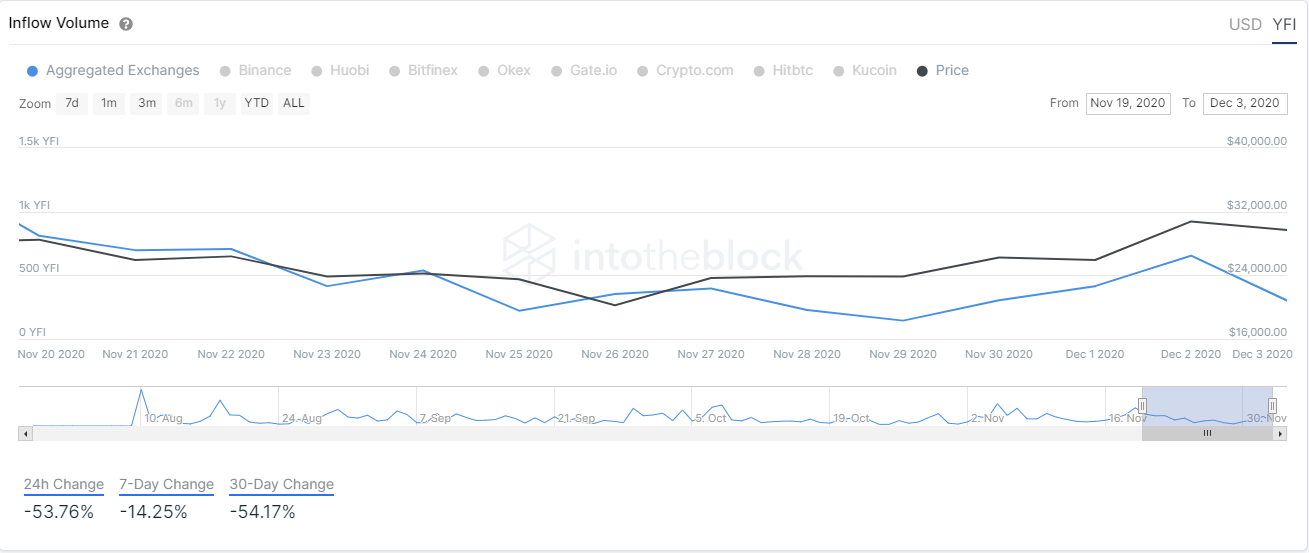
Additionally, the inflow volume of YFI has dropped significantly over the past month. This metric shows the number of YFI coins that are deposited into exchanges. Usually, a higher number is bearish as it indicates investors are looking to take profits by selling.
In this case, the number of YFI coins going to exchanges has dropped by 54% in the past month and 53% in the past 24 hours alone which indicates that investors are not looking to take profits but hold, a bullish indicator.
Make sure to join our Trading Group on Telegram for more awesome tips!