Yearn.Finance Price Prediction: YFI sees 140% price explosion in two days
YFI had a wild week jumping from a low of $7,451 on November 5 to a peak of $17,500, and still currently trading at $15,165, outperforming the market, even Bitcoin. YFI has been trading inside a massive downtrend since September […]


YFI had a wild week jumping from a low of $7,451 on November 5 to a peak of $17,500, and still currently trading at $15,165, outperforming the market, even Bitcoin. YFI has been trading inside a massive downtrend since September 13.
The digital asset formed a head and shoulders pattern which broke bearish on October 2 with a lot of continuation, dropping the price of YFI to lows not seen since August 16. The first time the RSI got oversold was on November 5 when YFI’s price exploded by 140% within 48 hours.
Yearn.Finance has regained the 12-EMA and the 26-EMA, turning both into support levels.
YFI Price Analysis: On-Chain Metrics
The In/Out of the Money Around Price chart shows very little resistance on the way up. The most notable area seems to be contained between $15,171 and $15,597, which has 1,610 YFI in purchasing power.
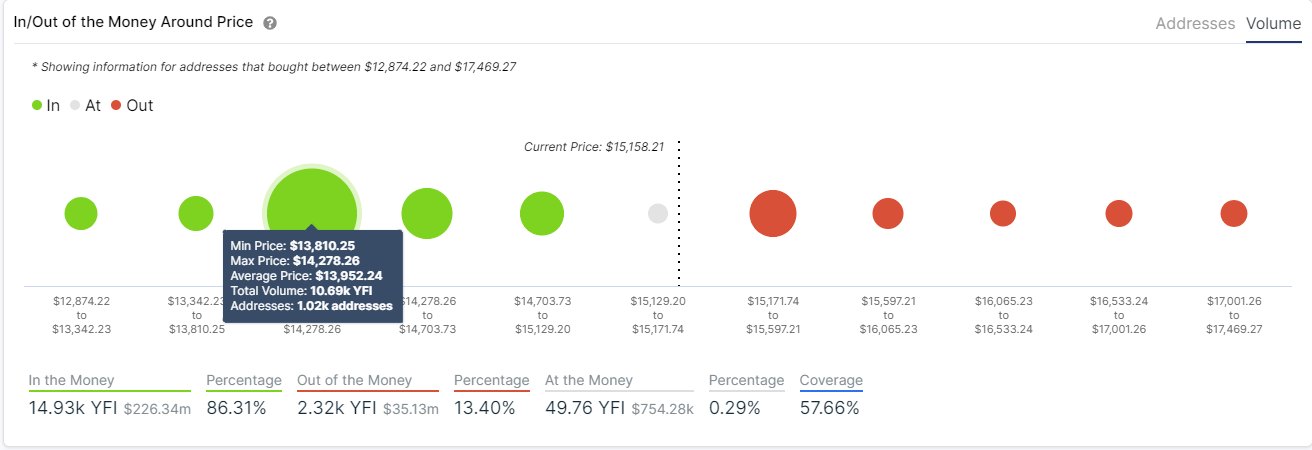
In comparison, the support area between $13,810 and $14,278 has 1,020 addresses that bought close to 10,700 YFI tokens, around 6 times stronger than the resistance ahead. The IOMAP chart suggests that YFI can easily climb towards $17,469 with very little opposition.
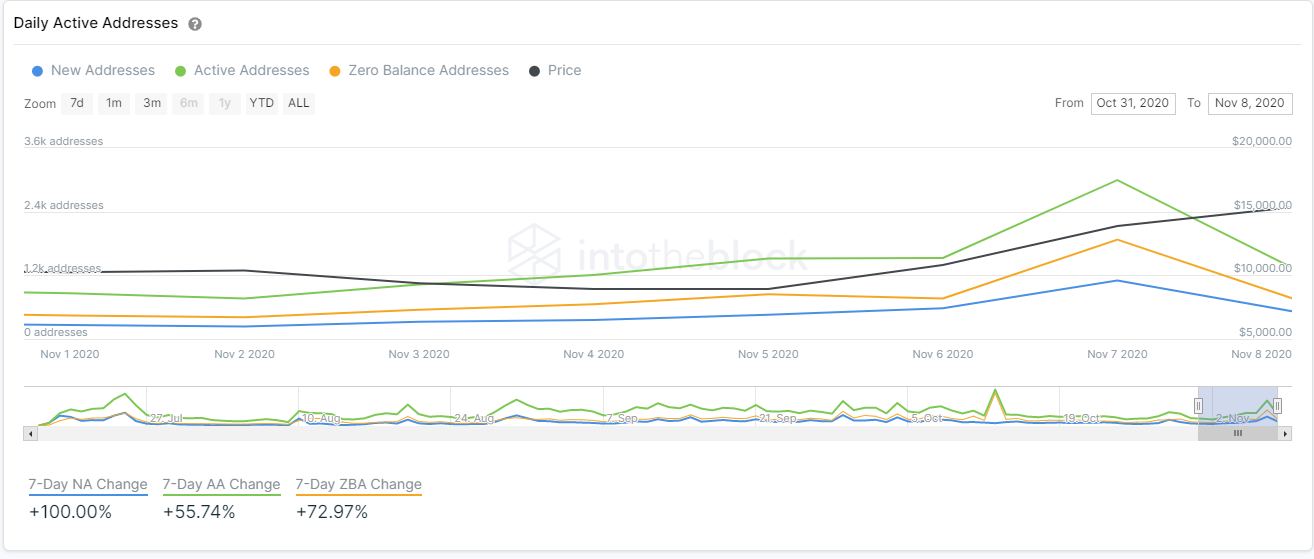
Even more interesting is the huge spike in the number of new addresses joining the network which has seen a 100% rise in the past 7 days. Similarly, the number of active addresses also jumped by 55%. These metrics indicate a huge rise in the increase in interest in the digital asset.
YFI Price Analysis: Technical Indicators
On the 4-hour chart, we can see a clear shift in the momentum of the trend which has turned bullish. The digital asset has climbed above the 50-SMA, 100-SMA, and 200-SMA.
Currently, YFI’s price seems to be forming an equilibrium pattern establishing several higher lows and lower highs. The pattern is on the verge of a breakout, which favors the bulls considering the recent momentum.
YFI/USD 4-hour chart – TradingView
A bullish price target would be around $20,000, while a bearish breakout would most likely drive YFI towards $12,000.
The 4-hour isn’t yet a confirmed uptrend as the bulls would need to establish a higher high compared to $17,500. It’s important to note that the 4-hour chart hasn’t been inside an uptrend since September 27.