Bitcoin Price Aims To Hit $12,000 In The Short-Term
Bitcoin is currently trading at $10,660 after a notable breakout on the daily chart. The digital asset has been flat for the past week and a half after a major crash on September 3. Bitcoin price slipped below $10,000 several […]


Bitcoin is currently trading at $10,660 after a notable breakout on the daily chart. The digital asset has been flat for the past week and a half after a major crash on September 3. Bitcoin price slipped below $10,000 several times but bulls managed to defend the crucial support level and are now seeing a bounce towards $11,000 again.
The daily chart had another strong support level at $10,253 in the form of the 100-SMA. The 10-SMA is now also acting as a support level.
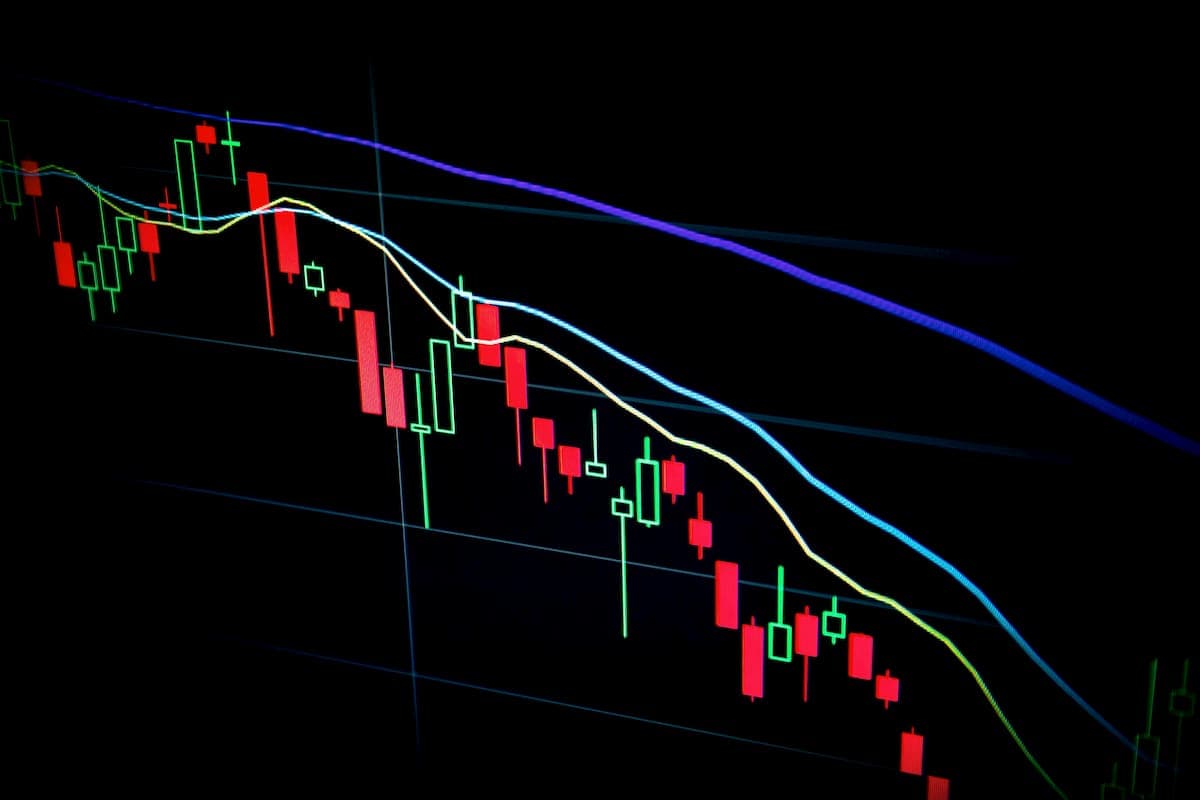
Bitcoin Price Analysis: Daily Chart
Bitcoin created a symmetrical triangle pattern on the daily and 4-hour charts. The pattern broke bullish yesterday but had no follow-through price action and dipped back down. Today, bulls tried again and so far seem to be successful with a 3% price surge to $10,750 on Binance.
BTC/USD daily chart – TradingView
A clear breakout of this pattern will very likely take Bitcoin above $11,000 and close to $12,000 as there are almost no resistance levels on the way up due to the magnitude of the crash. The next clear resistance point would be at $11,271 which is the 100-SMA. The RSI is also bouncing back up at 47 points currently. Trading volume seems to be increasing and the U.S. stock market is also recovering.
Today, the S&P 500 had a strong open and it’s up by more than 1.6%. Similarly, the Dow Jones is up by more than 1.4% while NASDAQ is up 1.83%. This is bullish news for Bitcoin and the crypto market as they have been extremely correlated with the U.S. stock market.
S&P 500 Price Forecast: Ready For A Bounce to the 3,440 Level
Bitcoin Price Forecast: Weekly Chart
While zooming out, we can clearly see how bullish Bitcoin has remained despite the past bearish action. Bulls have defended the closest higher low level at $8,833 and are now waiting for the next leg up of the weekly uptrend. The 10-SMA is currently acting as a resistance level but should pose no threat for the bulls.
BTC/USD Weekly Chart – TradingView
On the way up, there are practically no resistance levels besides $12,000 as a psychological level and then $13,147 and then $13,970. The RSI remains bullish as most technical indicators are still showing buy signals for Bitcoin for the long-term.