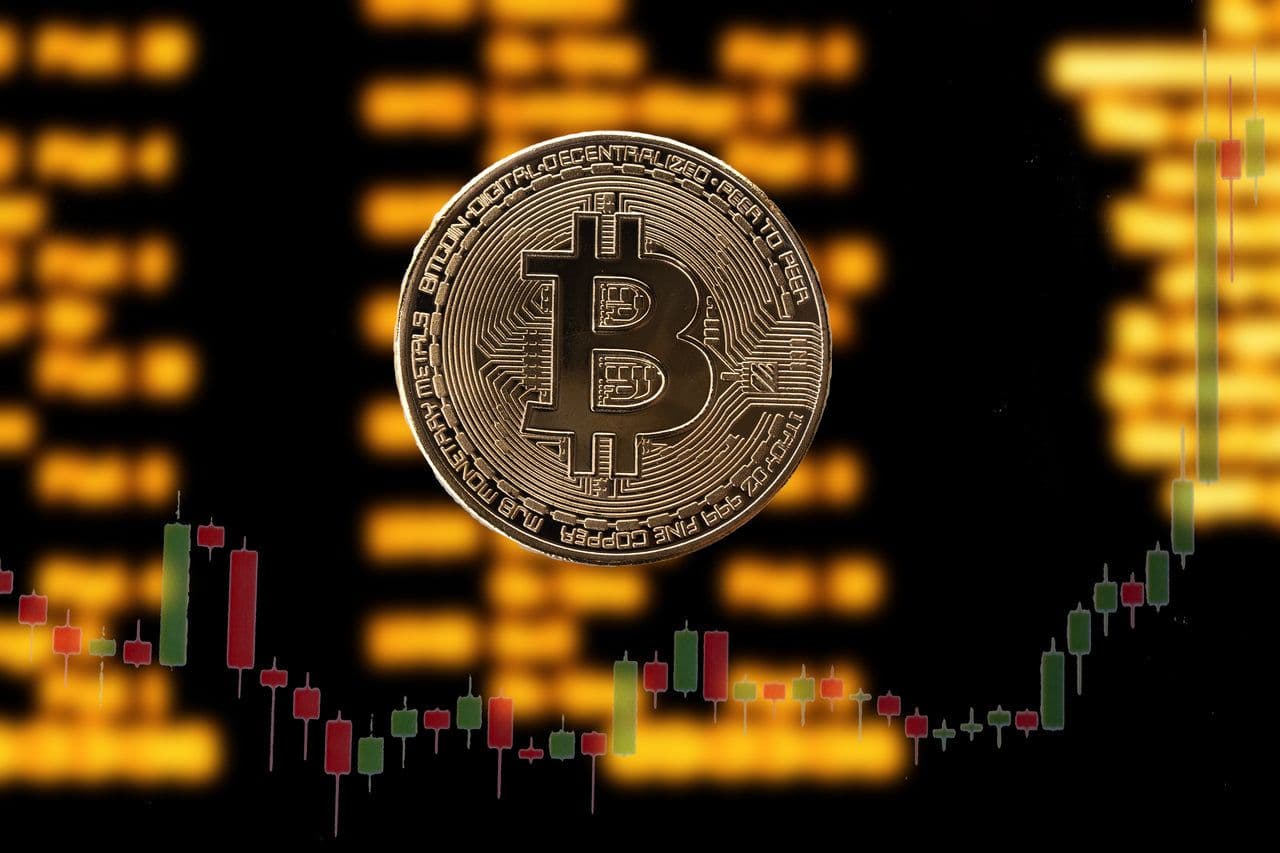
Bitcoin Price Prediction: Bitcoin About To Explode? Here’s Why You Should Invest Now
The important question here is should you invest in Bitcoin now? Is Bitcoin price about to explode more? Let's take a look at it in more detail.

The Bitcoin price could be on the path of one amazing journey. At the time of writing this, the BTC price is sitting at $51,206.57. It seems that a global pandemic is turning out to be beneficial for Bitcoin. The important question here is should you invest in Bitcoin now? Is Bitcoin price about to explode more? Let’s take a look at it in more detail.
Bitcoin Price Analysis: Why you should invest now?
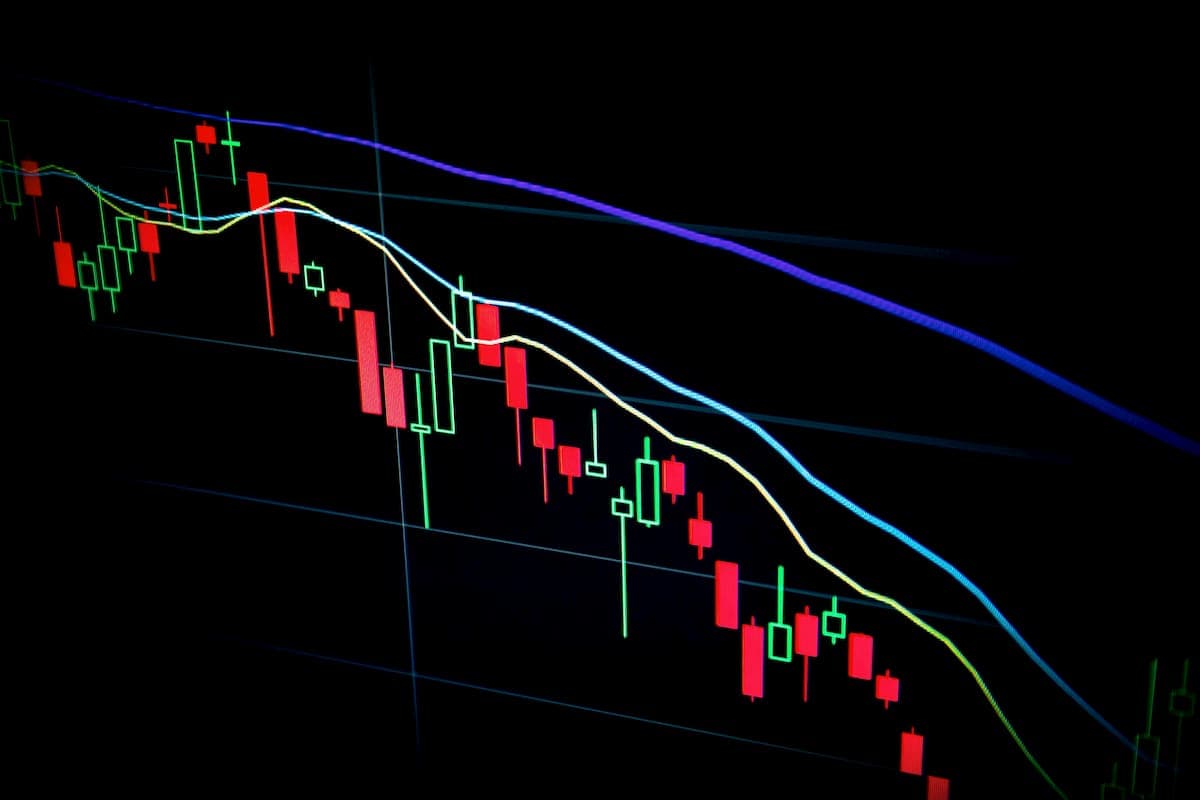
Bitcoin did touch the $60K mark earlier this month but then it decreased drastically. The price consolidations are normally a good sign. This is because consolidation events are essential as they help traders to put themselves for the next movement and are required for accumulation and distribution. So, this could be one of the signs why one should invest in BTC now.
Bitcoin Price: BTC/USD 4-hour chart showing previous price-action of BTC – TradingView
Yes, as Bitcoin touches new all-time highs, volatility is expected to build. We have already seen some important price tops to the upside and the downside in the past few days. The short-term price action of Bitcoin is exceptionally volatile and almost difficult to predict.
Now, if we closely examine the BTC/USD price 4Hr chart then it doesn’t look encouraging. Still, we could say that odds support the bulls in the short and long-terms. Most technical indicators are already bullish on almost all time-frames. Now, if we apply a Parabolic SAR then we can see that some dots have formed below the price and are in an upward pattern, this could suggest an uptrend for the Bitcoin price in the short-term. So, this could be the right time for investing in BTC.
Bitcoin Price Analysis: Bitcoin About To Explode?
Now, if we closely observe the weekly price charts, then we will notice that the long-term outlook for BTC price looks encouraging. The weekly chart appears to be in the comfort zone of the bulls but the 12-EMA and the 26-EMA could be important in the next 2-3 days.
Bitcoin Price: BTC/USD Weekly chart showing previous price-action of BTC – TradingView
Now, if we observe the weekly Parabolic SAR, then we will find that the dots have formed way far below the current price. It is between the $29,685 and $35,700 price range, and as per the Parabolic SAR, the rate of change is often described its sensitivity. This operates by extending the gap between SAR and price.
So, right now, the SAR dots are far from the current Bitcoin price in the weekly chart, which could indicate that the bitcoin price could increase in the next few days. The good thing could be that the lower SAR dots are too far from the current Bitcoin price in the weekly chart.