
Is Polkadot a Good Buy at Current Prices?
Polkadot has reclaimed its 50-day average and now trades only just below its 200-day average. What the chart, the RSI and supply mechanics mean for an entry. What speaks for buying at the current price — and what against it.





Which topics should we dive deeper into?
Select what genuinely interests you. Your picks feed directly into our editorial planning.
Crypto news that's actually worth your time.
Weekly. 60 seconds. Carefully curated by our editors: no hype, no promo flood, no spam.
Polkadot trades at around 1.17 US dollars on 9 October 2026. That is 71.3 percent below the twelve-month high of 4.08 US dollars set on 10 October 2025, but 56.0 percent above the twelve-month low of 0.75 US dollars from 19 August 2026. The price has pulled clear of its yearly low and reclaimed the 50-day average. Is Polkadot a good buy at current prices, or is this a recovery that ends at the longer-term average?
cryptoticker.io compiled the price data for this analysis on 9 October 2026. The market data comes from CoinMarketCap, and we evaluated the daily closing prices of the past 365 trading days up to and including 8 October 2026. The indicators are calculated with standard formulas: the 200-day average and the 50-day average as exponentially weighted means, the RSI over 14 days according to Wilder. Every value changes with each trading day.
Polkadot price analysis: where DOT trades and which levels matter
The Polkadot price of 1.17 US dollars sits above the 50-day average and below the 200-day average. The 200-day average stands at 1.18 US dollars and therefore 0.8 percent above the current price. The 50-day average stands at 1.07 US dollars, which is 9.0 percent below the price. The nearest level to the downside is therefore no longer the yearly low but this reclaimed line at 1.07 US dollars.
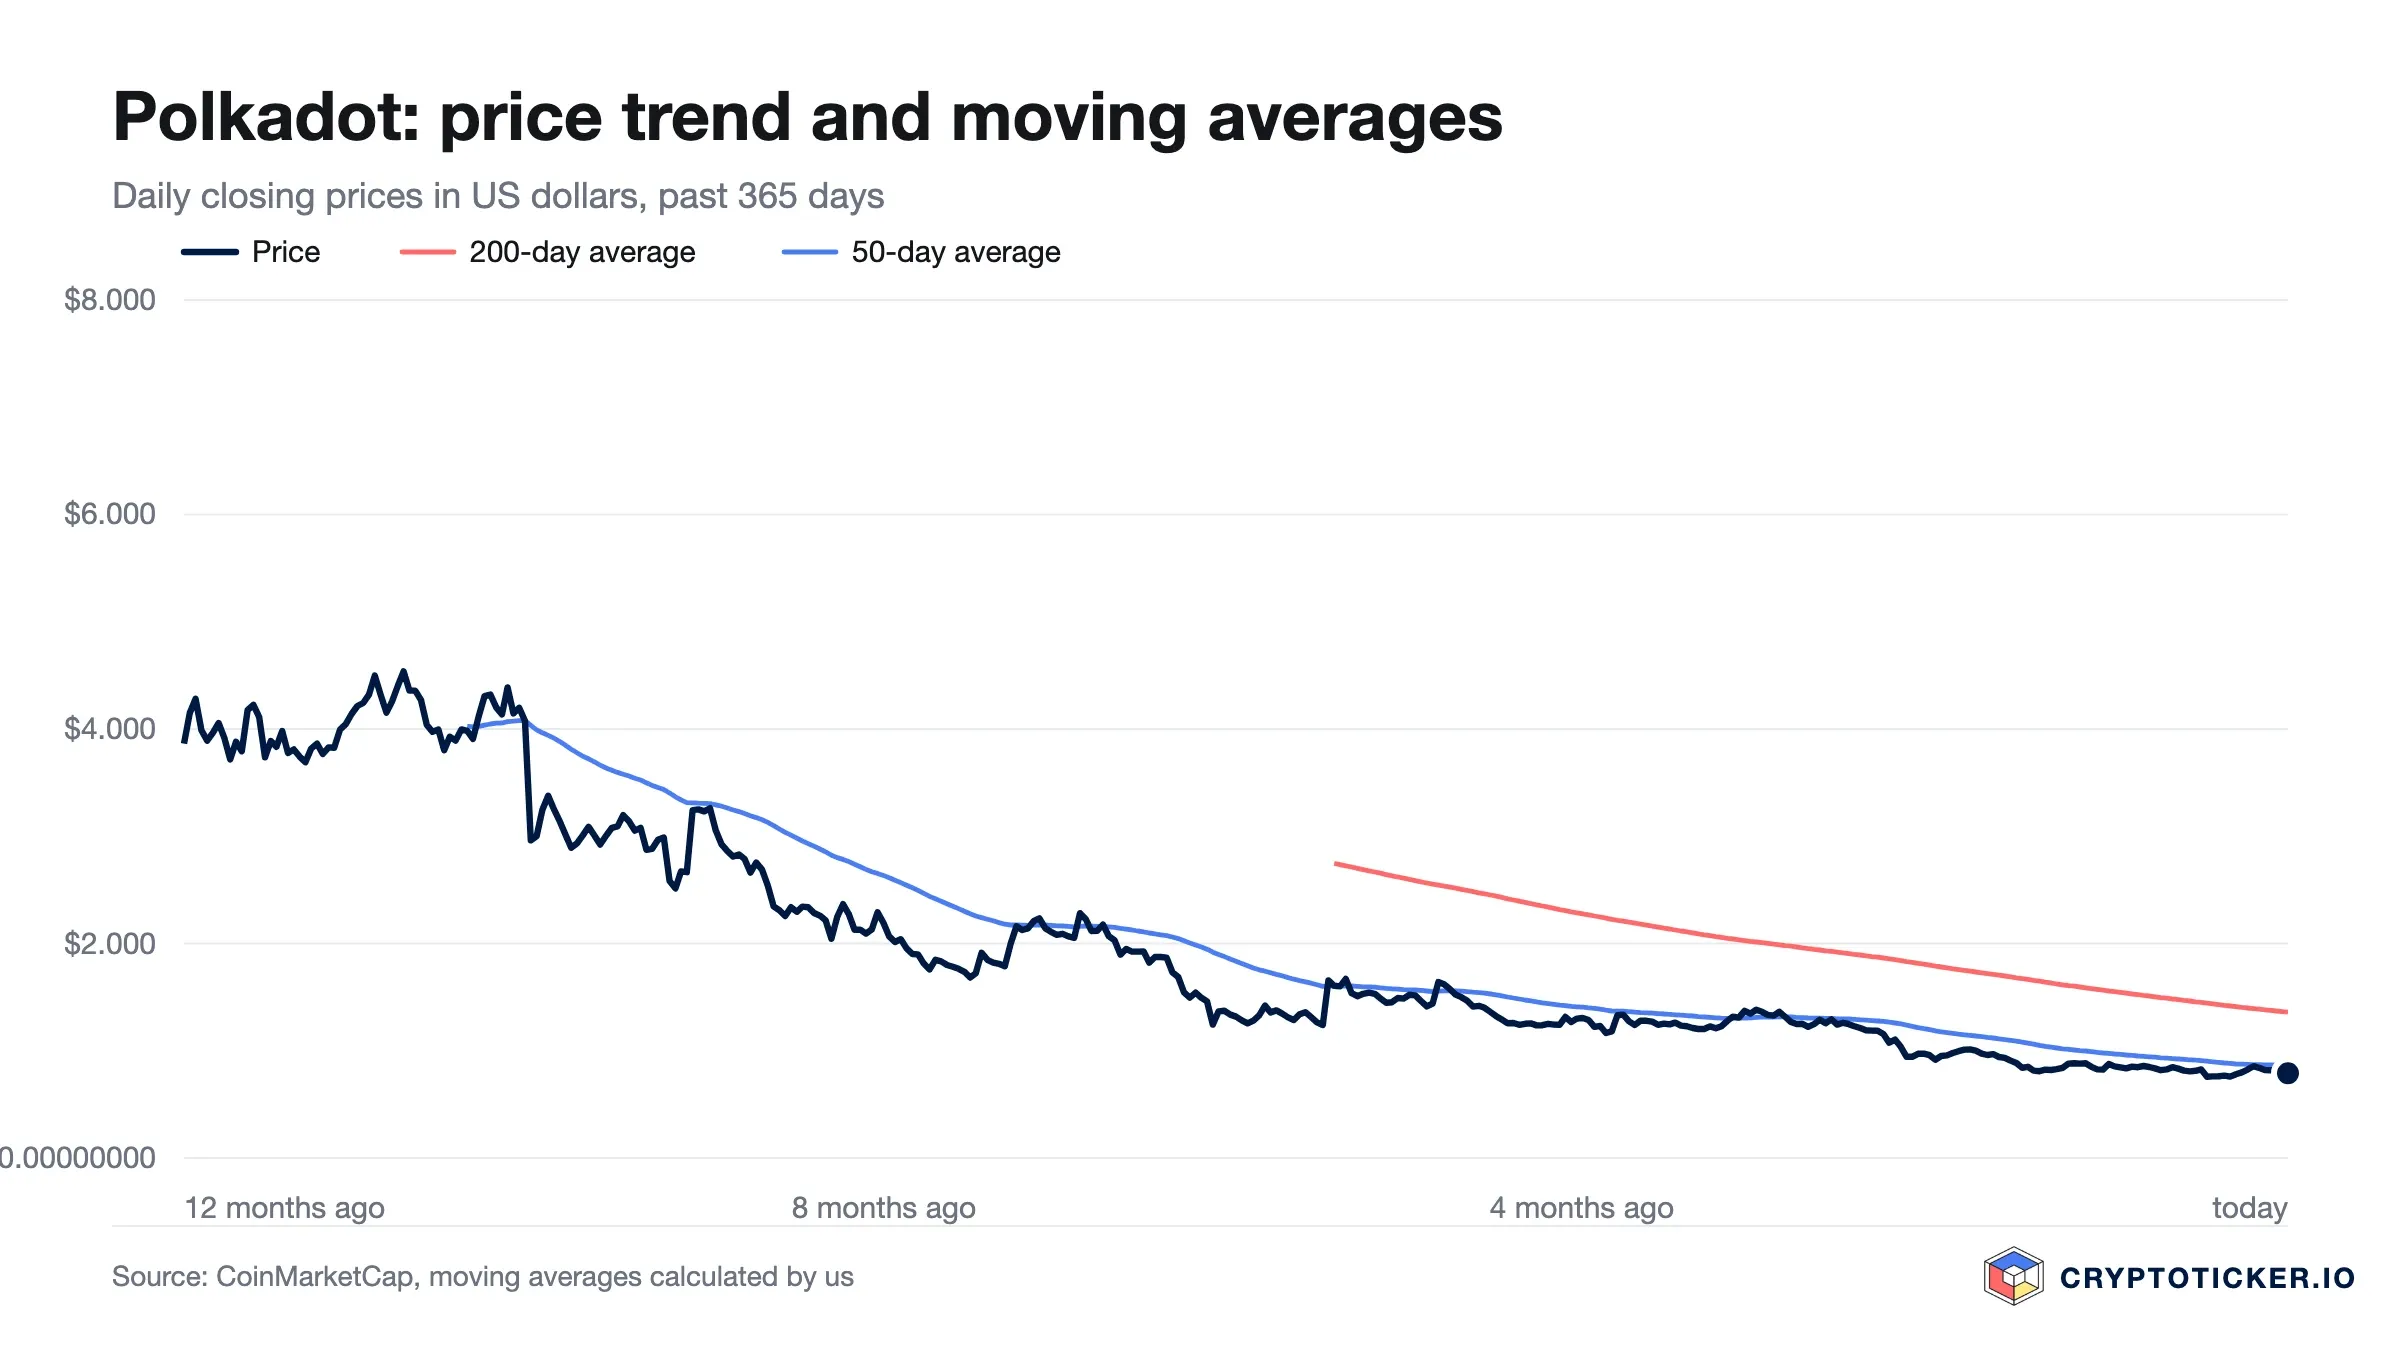
The range of the past 30 trading days is wide: all trading has taken place between 0.94 and 1.27 US dollars. For an asset that has lost 71.3 percent over twelve months, that counts as an eventful phase rather than a quiet one.
The medium-term changes show how young this move is. Over seven days DOT is up 1.5 percent, over 30 days 4.4 percent, and over 90 days the advance adds up to 37.2 percent. Most of the recovery happened in recent weeks rather than spread across the year. With a market capitalisation of 2.00 billion US dollars, Polkadot ranks 43rd among the largest crypto assets by market value. Where the price could go from here is something we track continuously in our Polkadot price prediction.
Is the Polkadot downtrend broken or only interrupted
A downtrend counts as broken once the price leaves a sequence of lower highs and lower lows and establishes itself above the medium-term average. For Polkadot both parts of that condition are now met. The July low of 0.76 US dollars was undercut once more on 19 August 2026, at 0.75 US dollars. From there the price has gained 56 percent and has traded above the 50-day average ever since.
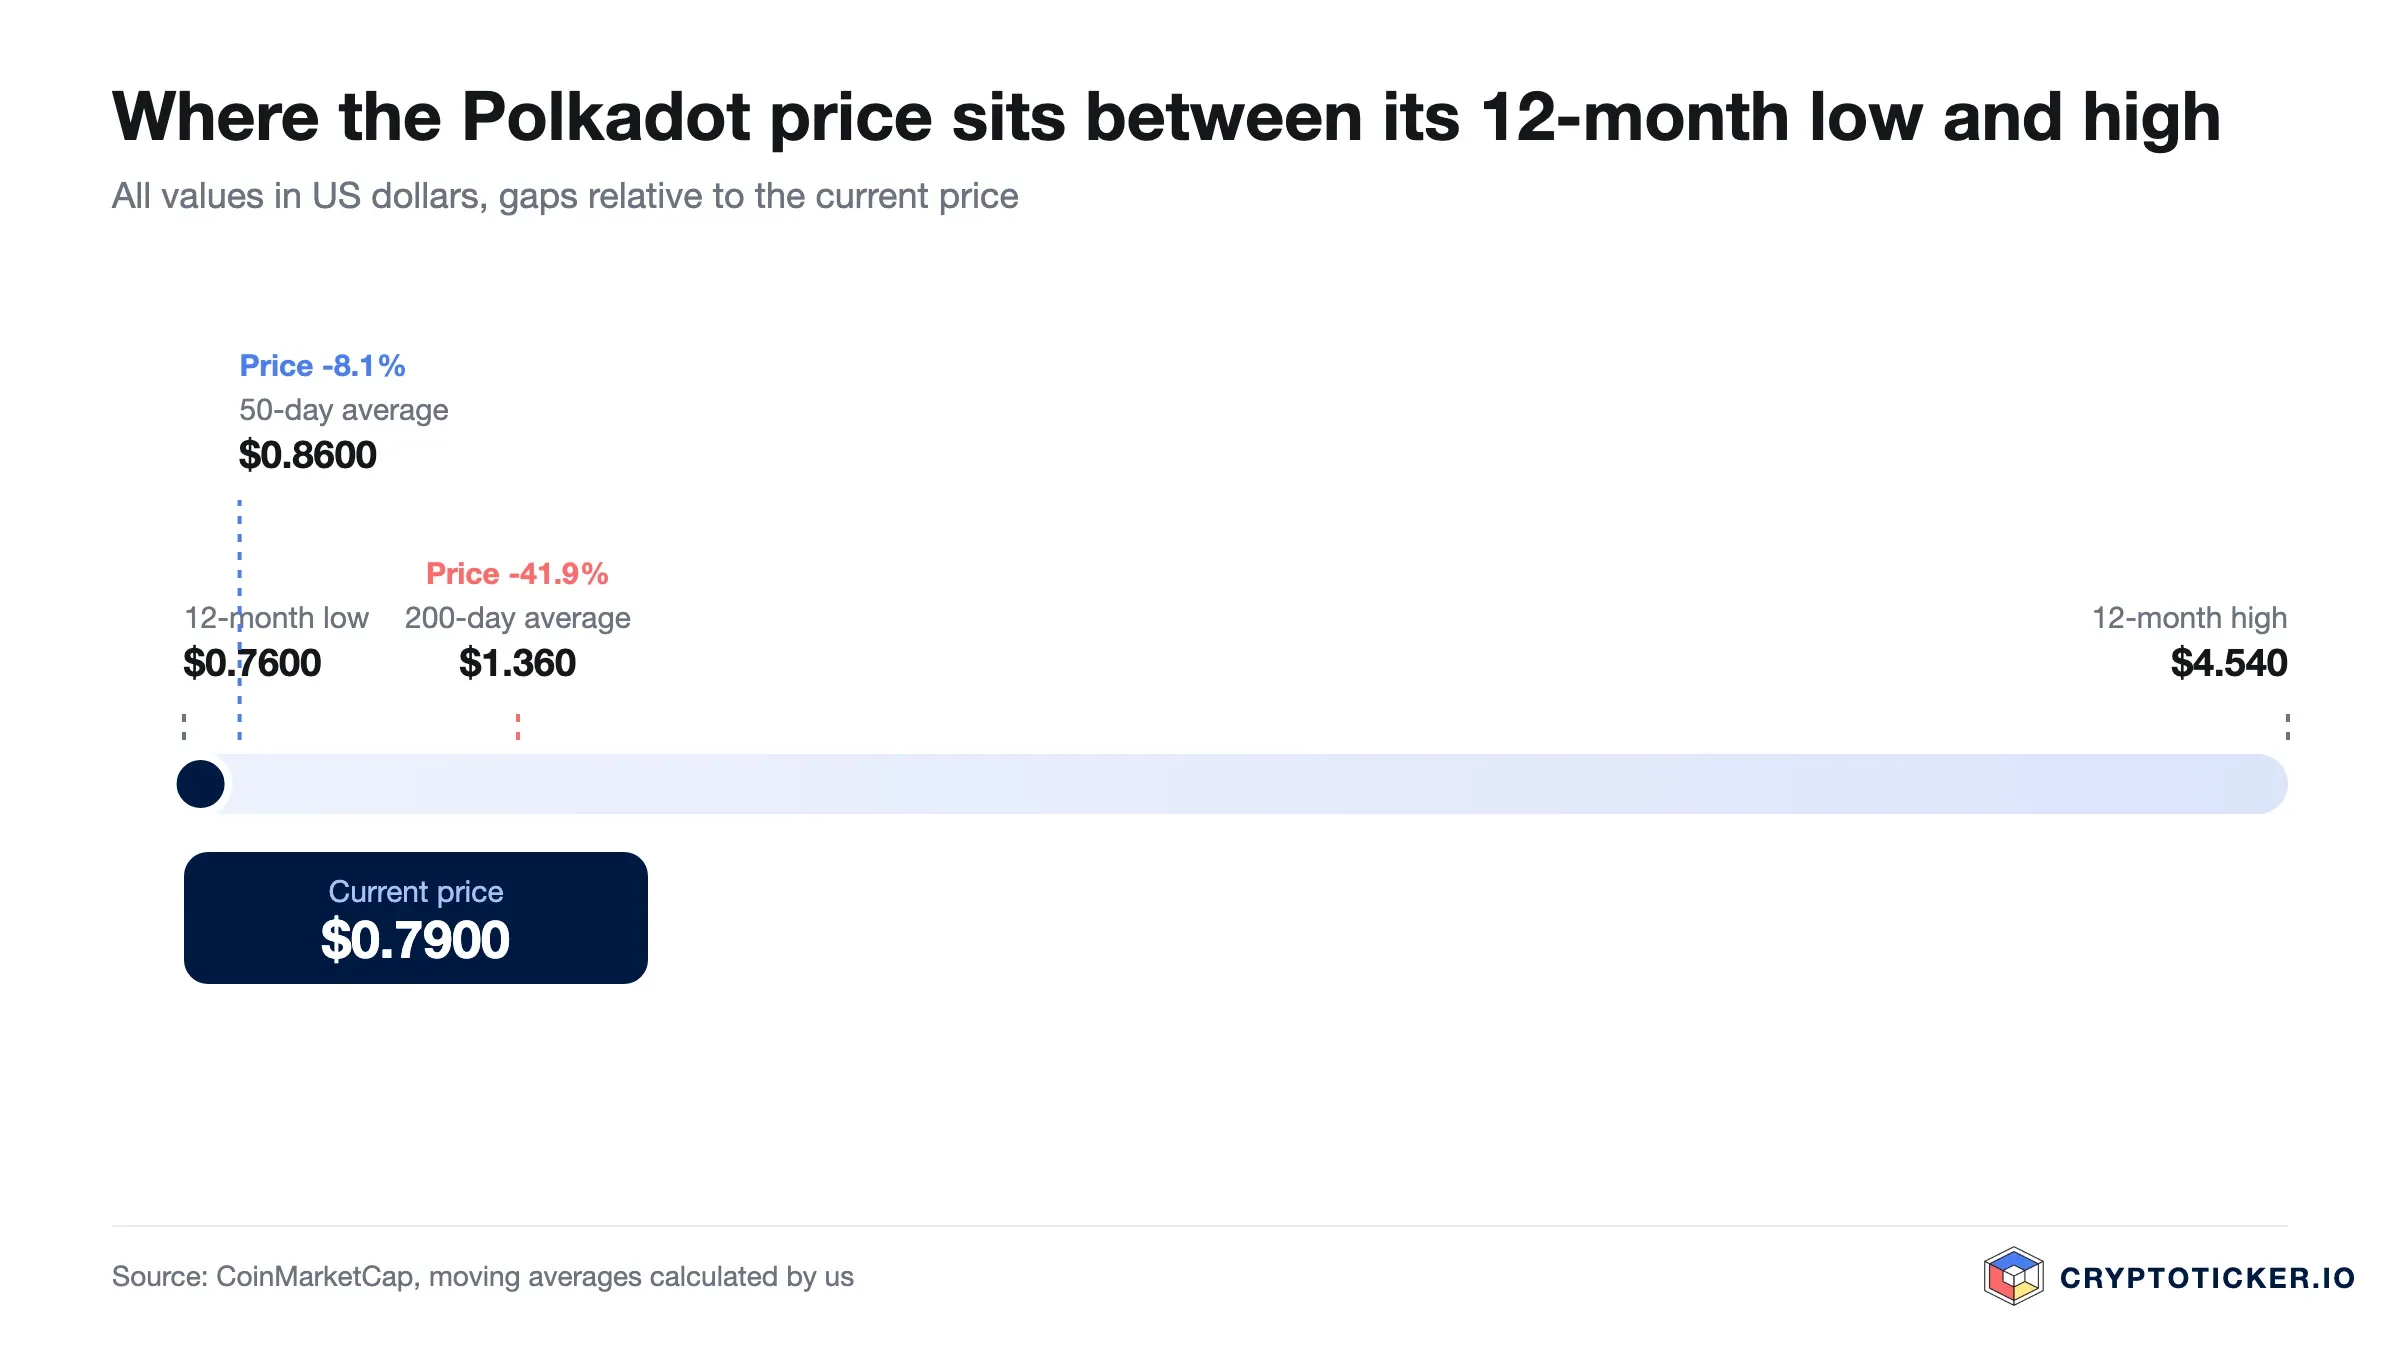
That leaves DOT in a recovery that has left the short-term average behind. This differs from the sideways range just above the yearly low, though it does not yet amount to a completed change of trend. The 50-day average at 1.07 US dollars now runs below the price, while the 200-day average at 1.18 US dollars still runs above it, 0.8 percent away.
Two scenarios follow from this data. In the first, the zone around 1.07 US dollars holds and the price works its way up to the 200-day average at 1.18 US dollars. In the second, it falls back below the 50-day average, which would make the recovery a counter-move inside a larger downtrend.
What RSI and moving averages mean for a Polkadot entry
The RSI over 14 days stands at 53.2 points. The indicator measures the ratio of price gains to price losses. Readings below 30 are considered oversold and readings above 70 overbought. Polkadot sits in the upper half of the neutral middle of that scale.
For the entry question this cuts both ways. An RSI above 70 would warn against chasing a move that has already run its course. No such reading is present here. At the same time the selling pressure has visibly eased: the digested sell-off has turned into buying pressure without the market having overheated.
The moving averages fill in the picture. As long as the price trades above the 50-day average of 1.07 US dollars, the short-term tendency runs in favour of an entry. The gap of 0.7 percent to the 200-day average of 1.18 US dollars shows how far away the last remaining hurdle is. That gap closes either through a rising price or through a falling average, and the average is still falling at present because the high prices of autumn 2025 are dropping out of the calculation window.

What Polkadot trading volume reveals about demand
Polkadot worth 282 million US dollars changed hands over the past 24 hours. Measured against the market capitalisation of 2.00 billion US dollars, that equates to a turnover rate of around 14 percent, a high figure for assets of this size.
For a buying decision the direction of this measure matters more than its level. A floor that forms on rising volume is considered more durable than one that forms on thin trading: in the first case holdings move from willing sellers to committed holders, in the second the price simply stalls. At Polkadot the trading volume of the past seven days, at 191 million US dollars a day, runs around 2 percent below the 30-day average of 195 million. The advance is therefore not accompanied by rising volume but by volume at its monthly norm, which leaves it without the confirmation of the first case.
The wider market backdrop fits that reading. The CoinMarketCap Fear and Greed Index stands at 56 points on 9 October 2026 and therefore in neutral territory. Investors are neither markedly confident nor fearful. A gauge of market sentiment says nothing about the prospects of any individual asset.
Structural factors that speak for Polkadot: supply mechanics, usage and regulation
On the supply side Polkadot differs from crypto assets built around scarcity. Around 1.71 billion DOT are in circulation according to CoinMarketCap, and the data provider lists a maximum supply of 2.10 billion DOT. Roughly 81 percent of that stated maximum is therefore already in the market. New units are created continuously because the network pays rewards to those who lock up DOT to secure it. The project sets out the details in its technical documentation.
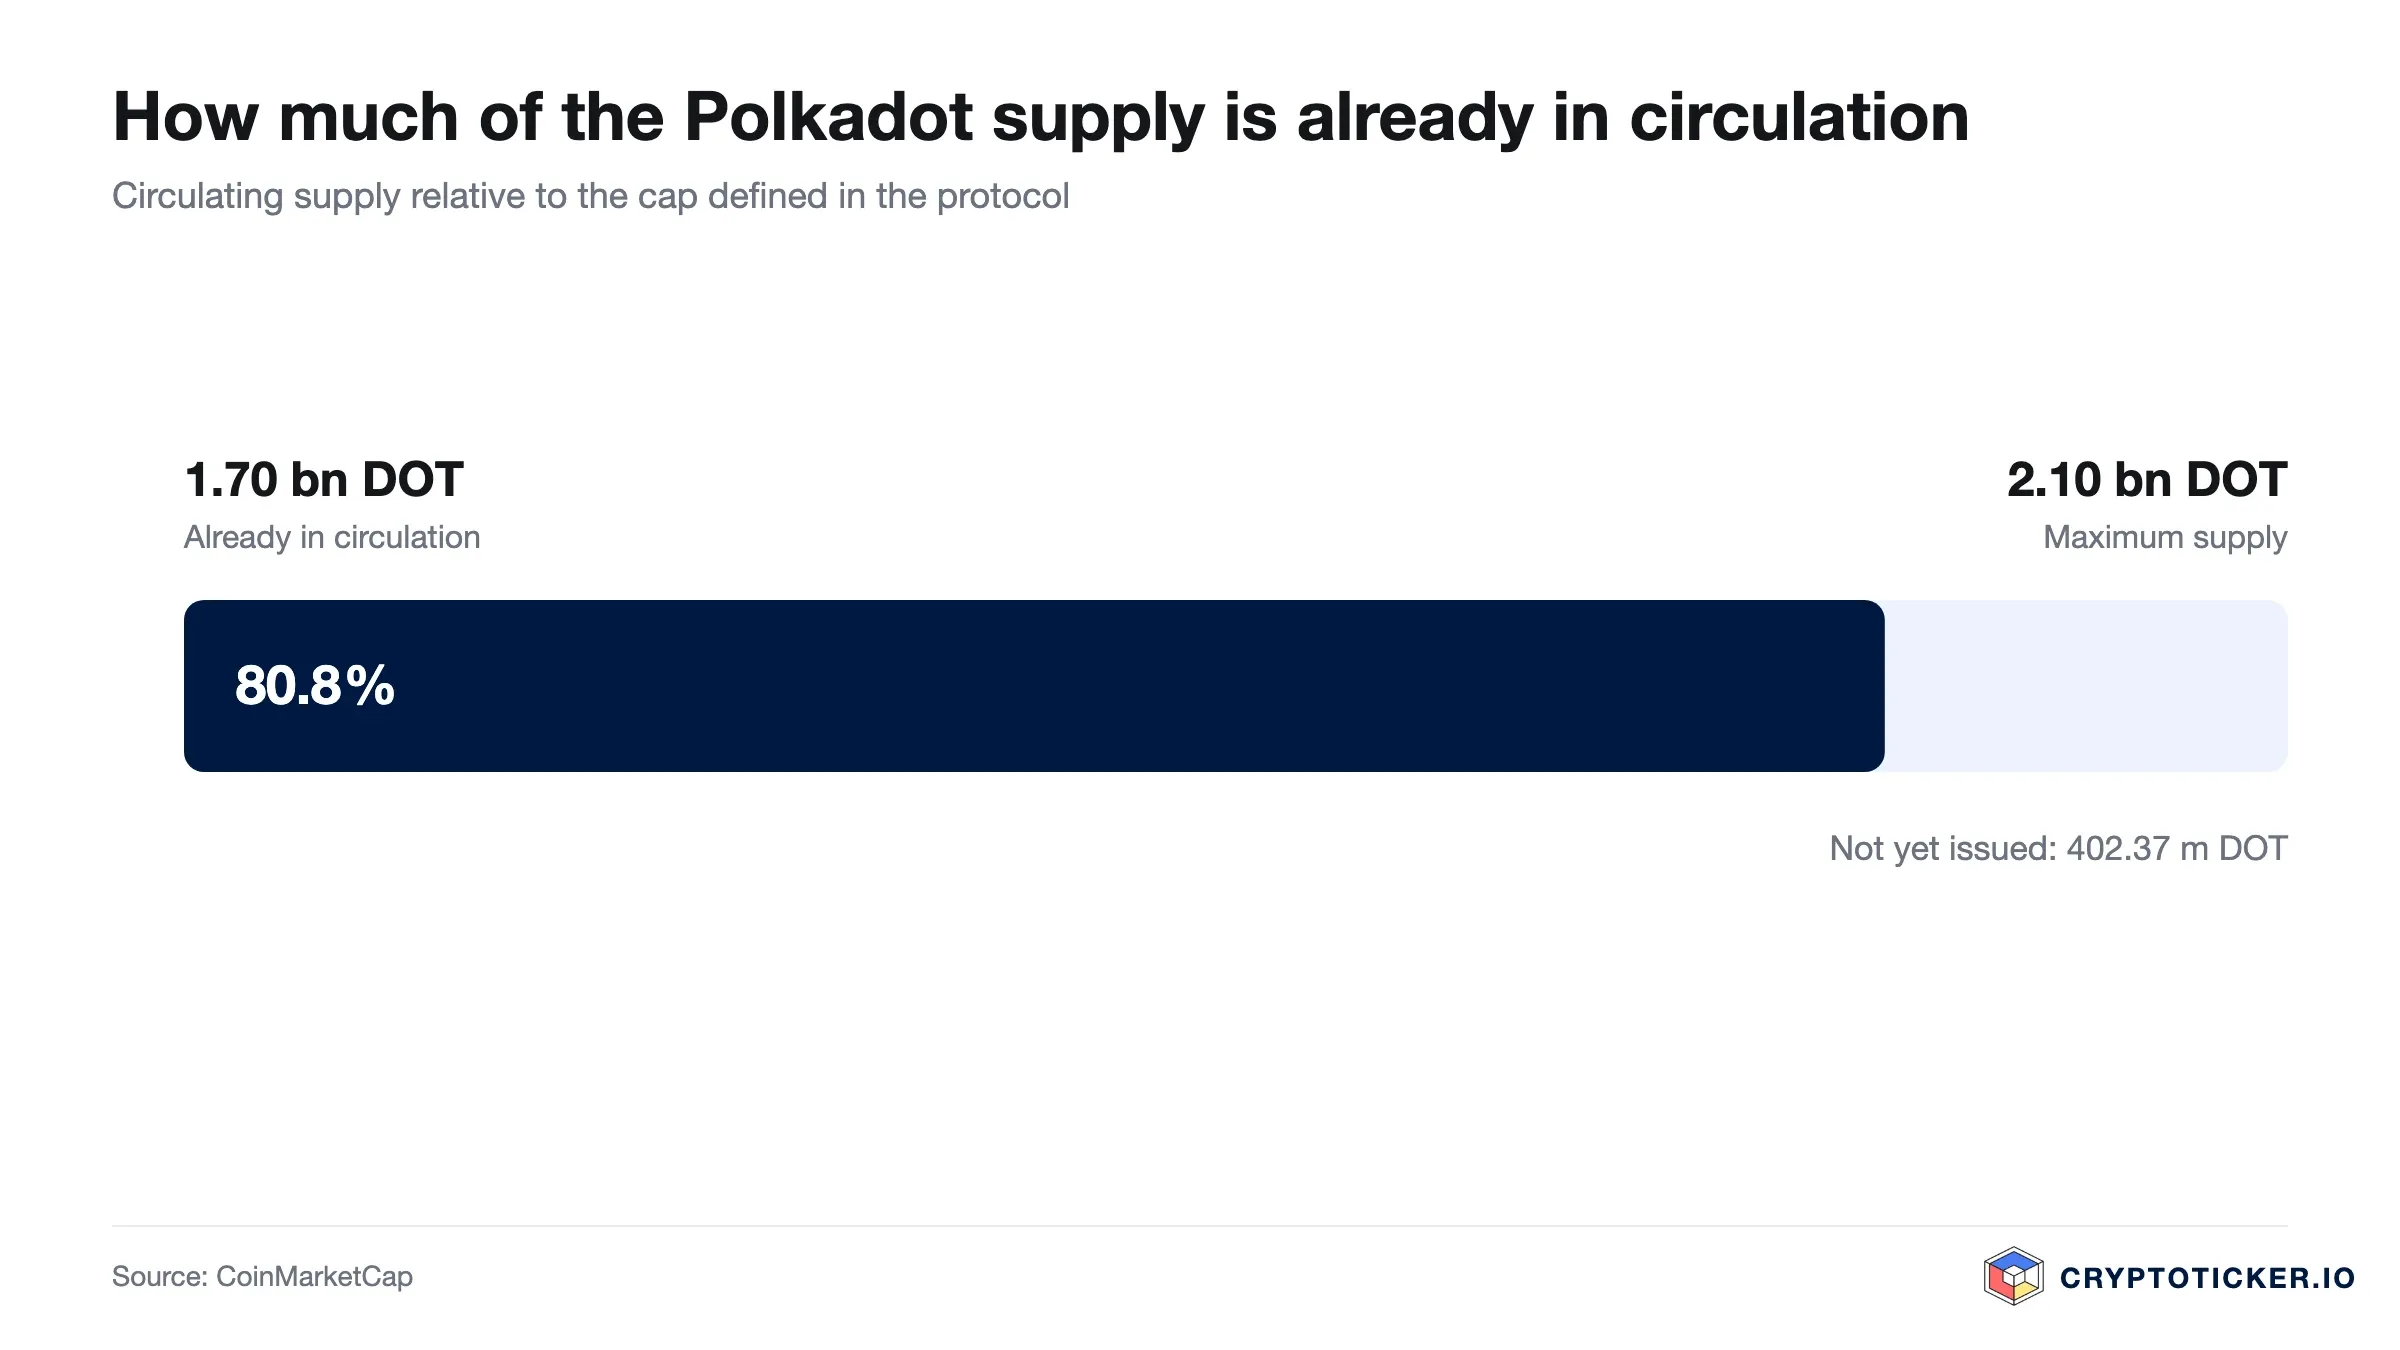
For buyers the consequence is straightforward. A holding that is merely held loses relative weight as the total supply grows. Anyone who locks up DOT receives compensation for it, takes on additional risks and ties up the holding for the length of the unbonding period.
On the usage side Polkadot stands for an architecture that connects individual blockchains to a shared security layer instead of asking every chain to build its own. That approach has been competing for years with solutions built on top of Ethereum, and the price history shows that the market currently rates the bet cautiously.
The regulatory environment in the European Union has settled. Trading venues that serve customers in the EU fall under the rules for crypto asset service providers, whose interpretation is guided by the European securities regulator ESMA. For you as a buyer that means the requirements for custody and disclosure have risen. No conclusion about the price of an individual asset follows from it.
What speaks for buying Polkadot at current prices
First, the valuation measured over twelve months. At 1.17 US dollars you pay 71.3 percent less than at the high of 4.08 US dollars in October 2025. Anyone who considers the architecture viable acquires the same share of the network for a fraction of the price back then.
Second, the reclaimed average. The 50-day average at 1.07 US dollars now runs below the price and forms the next line of support. An entry can be managed against a clearly defined level below which the assumption would be disproved.
Third, the absence of overheating. The advance is running on trading volume at its monthly norm, around 2 percent below it, and an RSI of 53.2 points shows no overheating. An entry therefore does not chase a move that has already run its course.

What speaks against buying Polkadot at current prices
First, the 200-day average still ahead. The price trades 0.7 percent below the 200-day average of 1.18 US dollars, even though it stands 9.0 percent above the 50-day average of 1.07 US dollars. The long-term line has not been reclaimed. A purchase here bets that the recovery clears that last hurdle too.
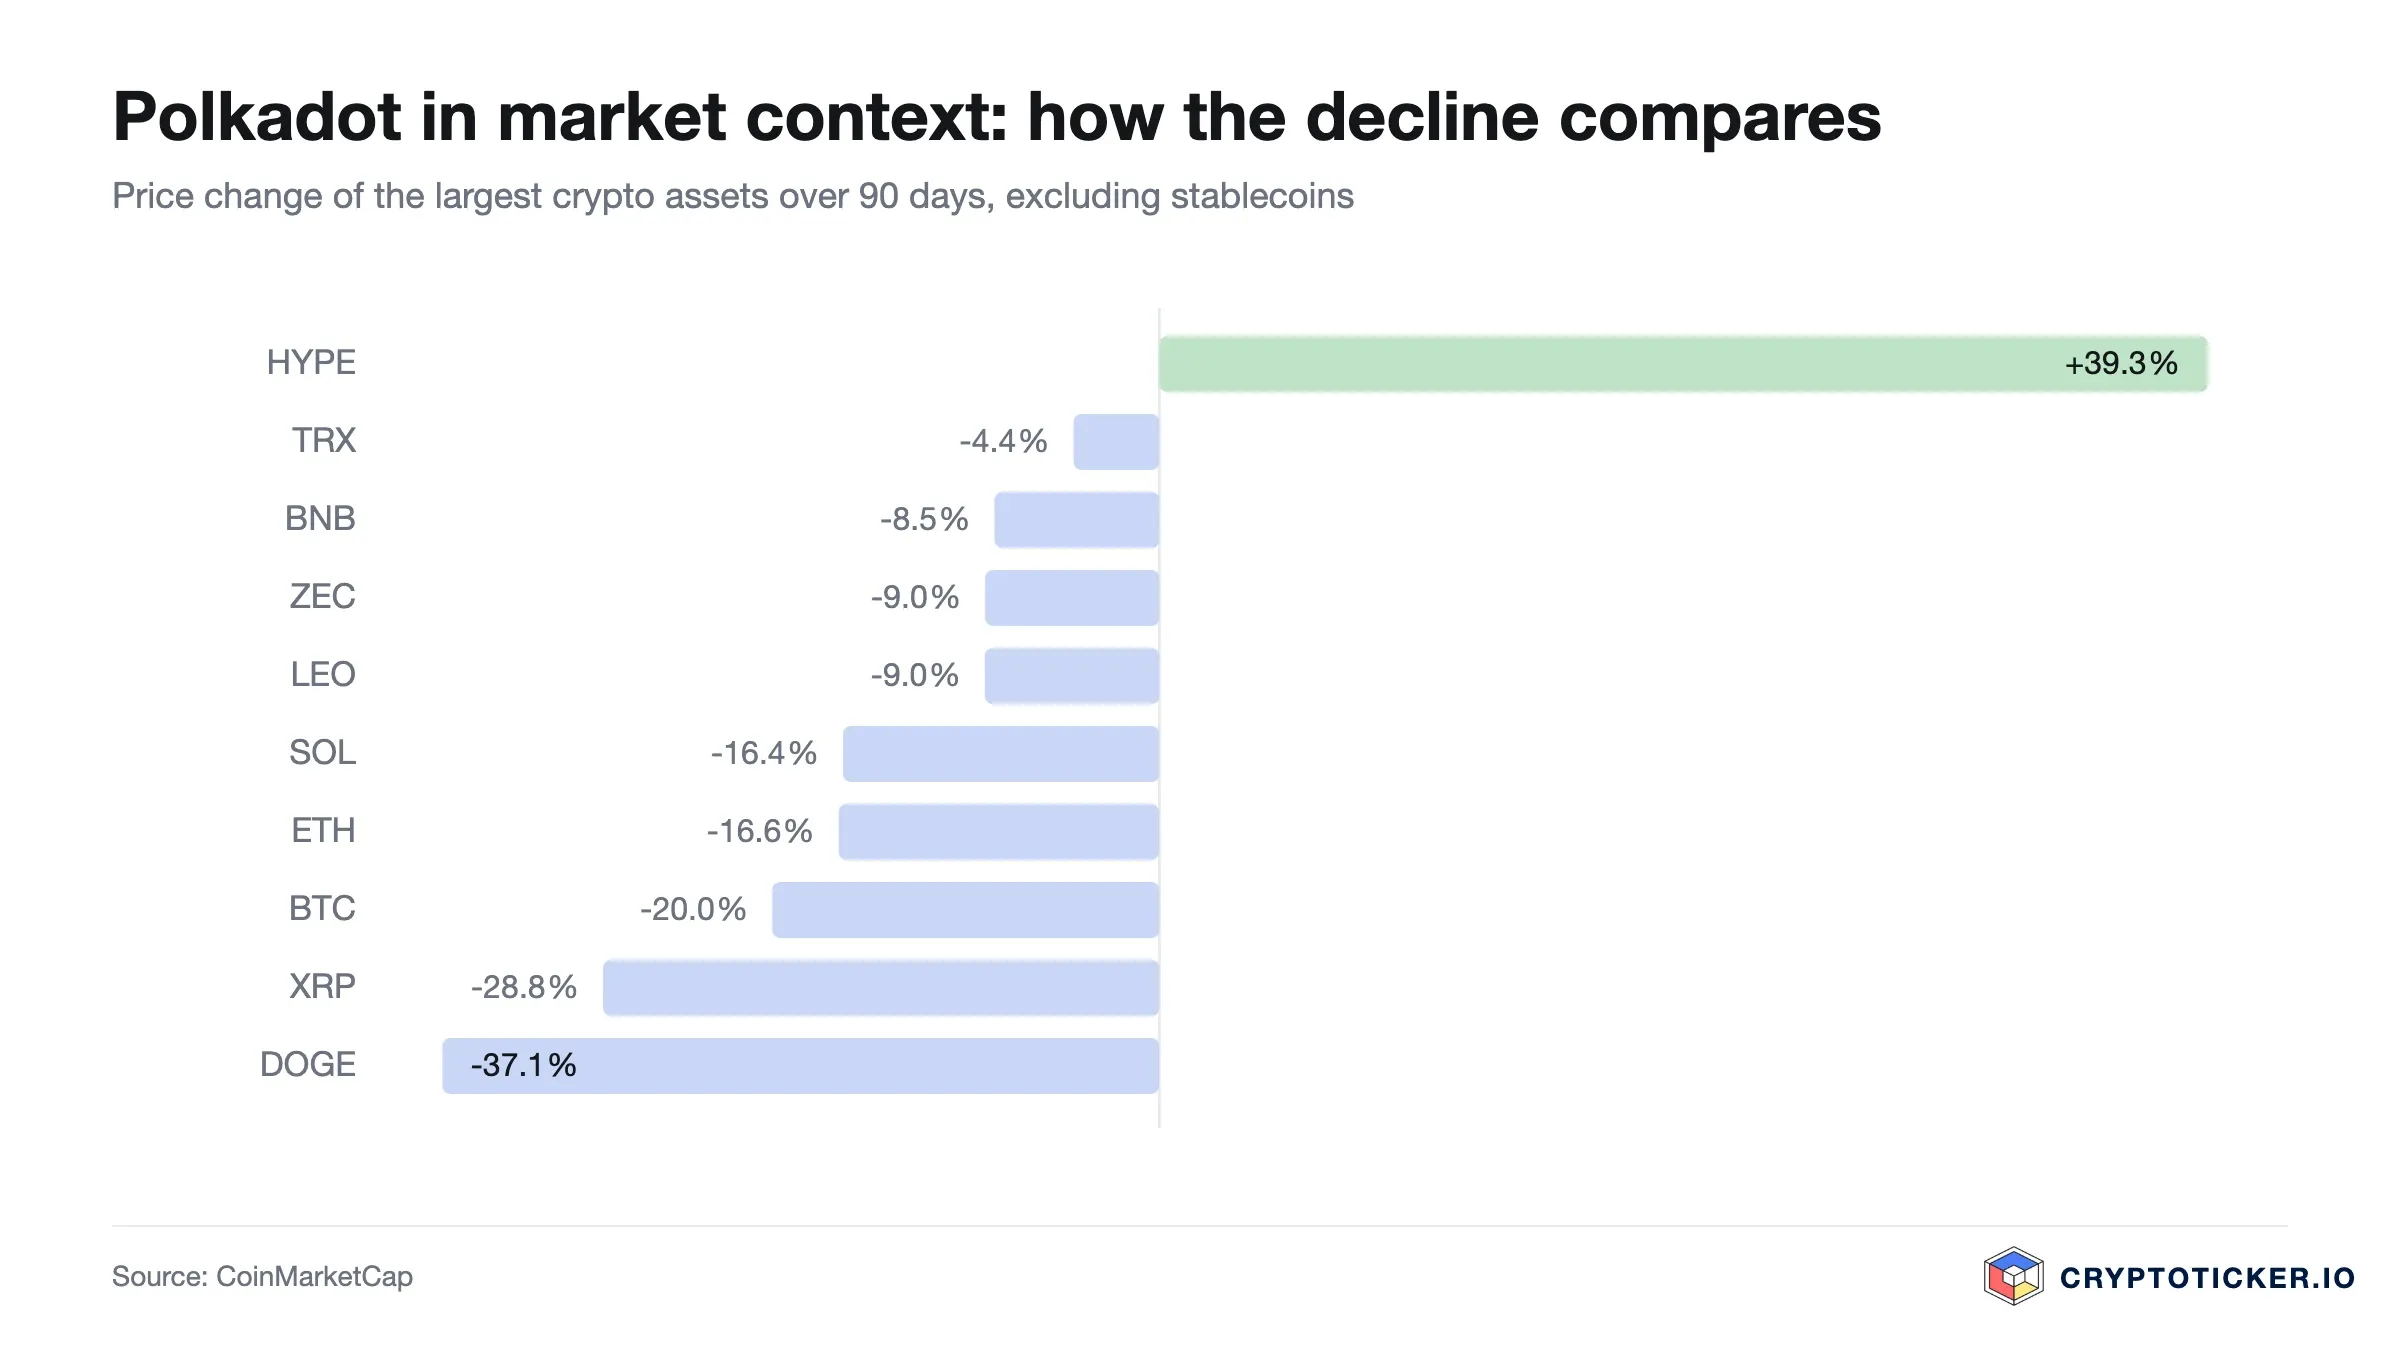
Second, the entry price you have missed. A full 56.0 percent separate the price from the twelve-month low of 0.75 US dollars. Anyone buying now pays around half as much again as in August, and the clearly defined support at the yearly low sits correspondingly far away.
Third, how young the data is. The turnover rate of around 14 percent and the recovery itself come from a handful of weeks. Without a continuation the change of trend lacks confirmation, while the continuing expansion of supply still works against the price.
How to buy Polkadot at current prices: costs, custody and providers
DOT is listed on all the larger European trading venues. Three items determine what a purchase actually costs: the trading fee per order, the spread between bid and ask, and the cost of a later withdrawal to your own wallet. On small amounts the spread weighs more heavily than the stated fee, because it sits inside the price and does not appear separately on the statement. How the providers rank is set out in our comparison of the best crypto exchanges.
If regulatory status matters to you, the overview of regulated crypto exchanges is worth reading. For the individual venues we publish reviews, for instance on Bitpanda, on Kraken and on Bitvavo. Those reviews show where the respective strengths and weaknesses lie in everyday use.
On custody: holdings kept on an exchange are convenient to trade and depend on the security of the provider. Holdings on your own hardware wallet sit outside that risk, and in exchange you carry sole responsibility for the access credentials. The amount at which the switch becomes worthwhile depends on how long you intend to hold. Our hardware wallet comparison ranks the common devices.
So is Polkadot a good buy at current prices, short-term and long-term
Over a horizon of weeks the data has turned. The price of 1.17 US dollars trades above the 50-day average, the RSI of 53.2 points stays in neutral territory without being overbought, but trading volume is only at its monthly norm. Buying here means buying into a recovery whose last open hurdle is the 200-day average at 1.18 US dollars.
Over a horizon of years the calculation looks different. A discount of 71.3 percent against the twelve-month high of 4.08 US dollars still values the project as though the technical bet were largely lost. Whether that is accurate will be decided by the usage of the network over several years. Against it stands the supply mechanism, which releases new units continuously and dilutes a passive holding in relative terms.
The assumption of a change of trend counts as disproved if the price closes back below the 50-day average of 1.07 US dollars on a daily basis. It counts as confirmed if DOT clears the 200-day average of 1.18 US dollars and closes above it on rising volume. The test after that would be the level around 1.27 US dollars, the high of the past 30 trading days. These three levels let you check your own assessment against the market.
Buying Polkadot: what to take away
- The Polkadot price of 1.17 US dollars sits 0.7 percent below the 200-day average of 1.18 US dollars and 9.0 percent above the 50-day average of 1.07 US dollars. The zone between those two lines is the range in which the situation is decided. The running assessment is in our Polkadot price prediction.
- An RSI of 53.2 points and a turnover rate of around 14 percent describe a market with upward momentum but no overheating. Anyone entering should know the cost of each purchase, and the exchange comparison shows where the differences lie.
- For a holding intended to sit for years, custody is the second decision alongside the entry price. Suitable devices are ranked in the hardware wallet comparison.
Disclosure: Some of the providers mentioned in this article work with us through partner programmes. This has no influence on the price analysis or on our assessment of the chart; the price data comes from a public market data source and can be verified there.
(As of 9 October 2026. This article is not investment advice. Prices, fees and terms change; check them with the provider before every purchase. Crypto assets are subject to high price volatility and a total loss is possible.)
Transparency note: This article was produced with the assistance of artificial intelligence and reviewed by our editorial team before publication. All figures and claims were checked against the primary sources linked in the text. The feature image was generated with AI.
Which topics should we dive deeper into?
Select what genuinely interests you. Your picks feed directly into our editorial planning.
Crypto news that's actually worth your time.
Weekly. 60 seconds. Carefully curated by our editors: no hype, no promo flood, no spam.
More from CryptoTicker