
Is Chainlink a Good Buy at Current Prices?
Chainlink trades 68 per cent above its yearly low but has dropped below its 50-day moving average for the first time since August, and turnover is thinning out further. What the chart, the RSI and supply mechanics mean for an entry now — and what speaks against buying.





Which topics should we dive deeper into?
Select what genuinely interests you. Your picks feed directly into our editorial planning.
Crypto news that's actually worth your time.
Weekly. 60 seconds. Carefully curated by our editors: no hype, no promo flood, no spam.
Chainlink trades at 12.05 USD, roughly 35 per cent below the 12-month high of 18.66 USD set on 21 October 2025, and about 68 per cent above the 12-month low of 7.19 USD from 1 July 2026. LINK has gained 46.0 per cent over the past 90 days and ranks as the sixteenth-largest cryptocurrency by market value at 9.25 billion USD. Hence the question: is Chainlink a good buy at current prices, or has the recovery already priced in the oracle network's rebound?
The price data in this article was collected by cryptoticker.io on 15 October 2026. We used the 365 daily closing prices of the past year and calculated the moving averages, the relative strength index and the 12-month extremes ourselves, using the standard formulas: exponential smoothing for the averages and Wilder's method for the RSI.
Chainlink price analysis: where LINK trades and which levels matter
At 12.05 USD, Chainlink still trades well above the range that contained the market through the summer. The lower boundary of that range was the 12-month low of 7.19 USD from 1 July 2026, which held on the first test and has not been challenged since. The 200-day exponential moving average at 10.95 USD, once the first hurdle above the price, now sits 10.0 per cent below it and has become the market's long-term reference line rather than its ceiling.
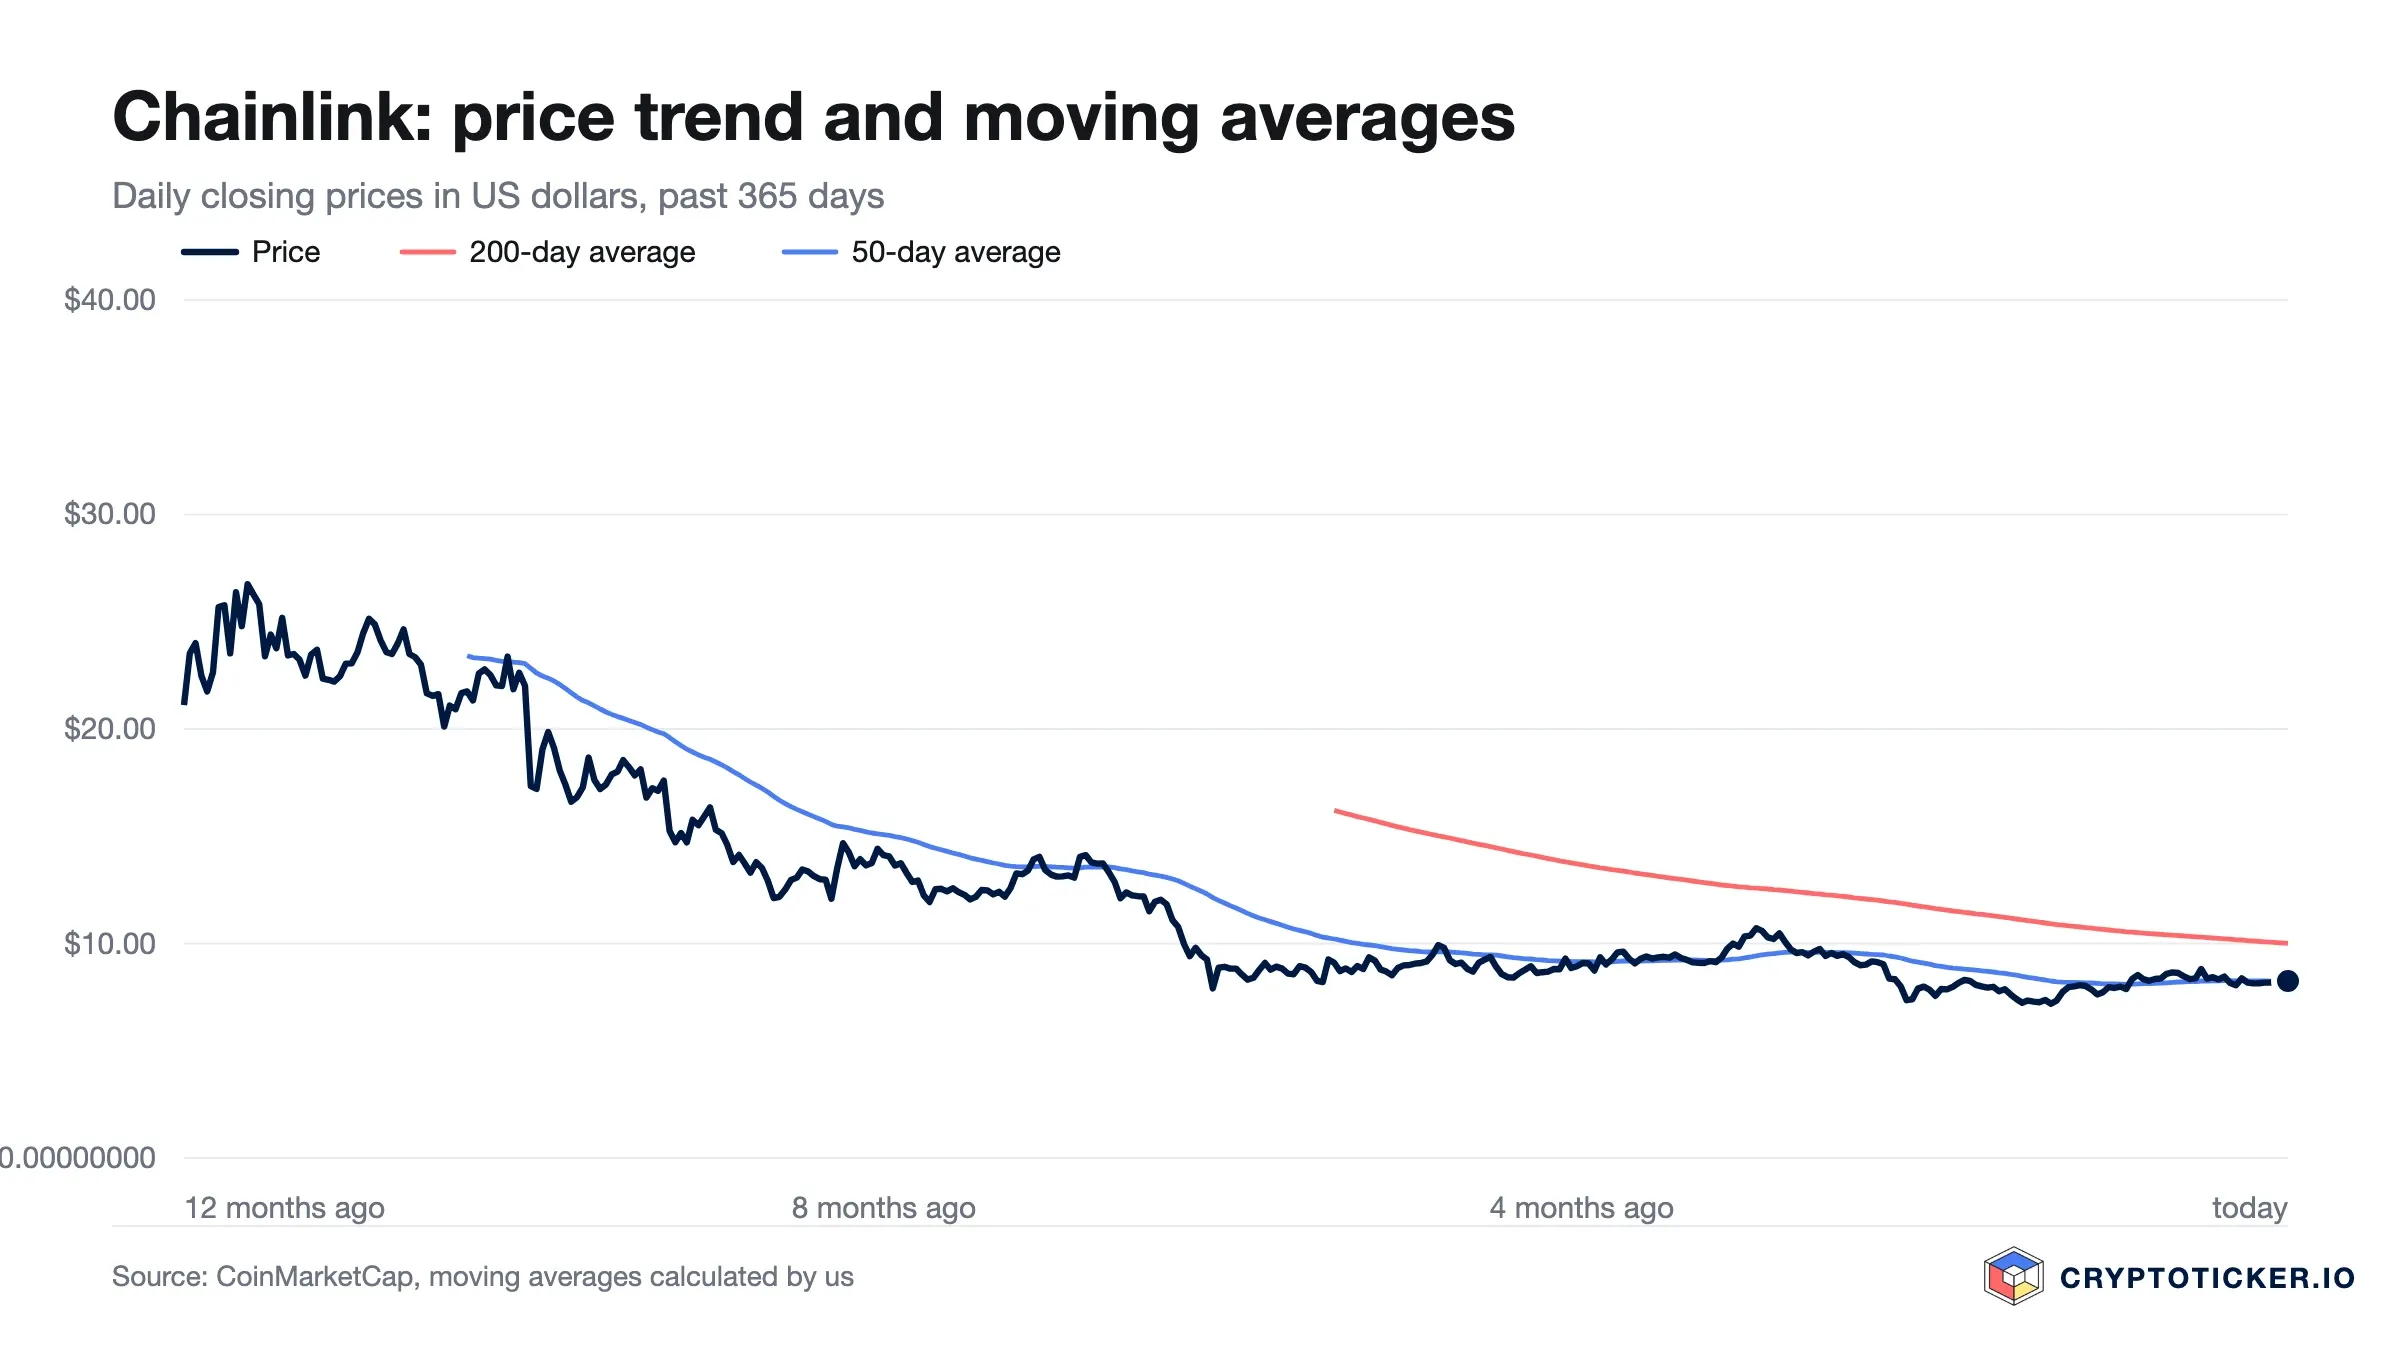
The 50-day exponential moving average at 12.46 USD is the closest reference point, and the price has slipped 3.3 per cent below it — the first time it has traded under that line since 10 August. It crossed above the 200-day average of 10.95 USD on 5 September, and the gap stands at 13.8 per cent in the shorter average's favour. Both lines are still rising, but the price no longer sits above both of them.
Three levels therefore frame any decision at current prices: 12.46 USD as the short-term average separating continuation from relapse, which the price has just lost, 10.95 USD as the longer-term line whose recapture defined the turn, and 7.19 USD as the floor that would have to give way for the summer stabilisation to be undone. The distance to the 12-month high of 18.66 USD stands at 35.4 per cent, which is a reminder of scale rather than a near-term target.
Is the Chainlink downtrend broken or only interrupted
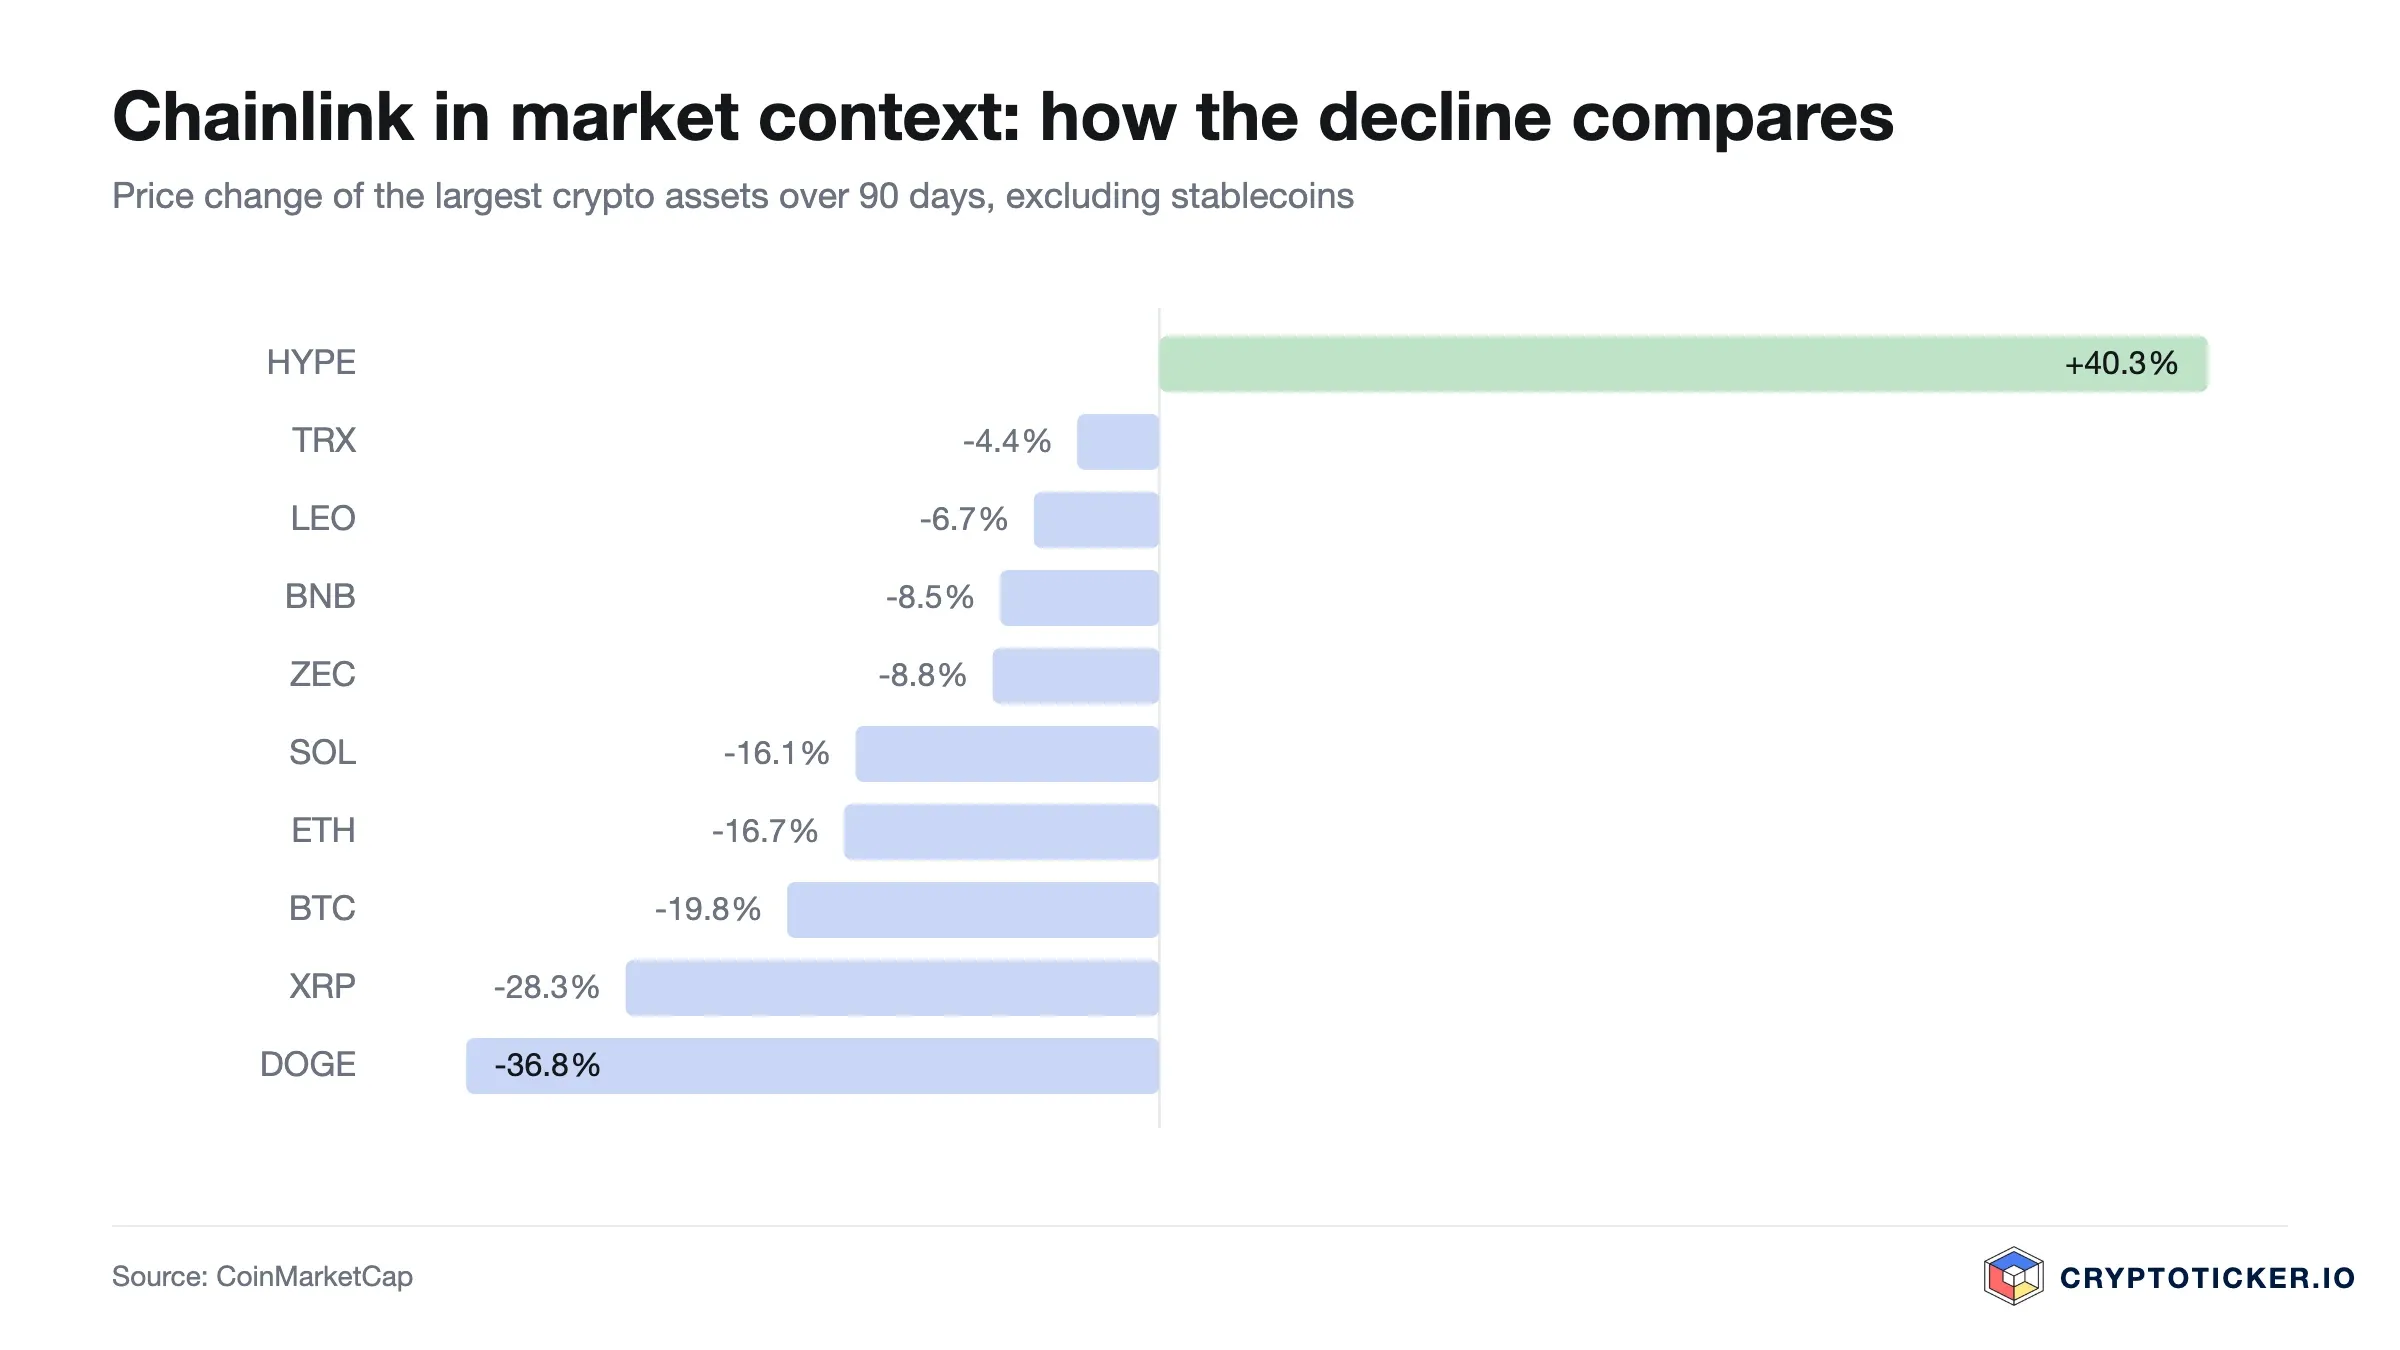
Over twelve months Chainlink has lost 33.3 per cent, measured against the close of 18.66 USD on 21 October 2025. Over 90 days, however, the figure turns positive at 46.0 per cent, while over 30 days it is 10.7 per cent and over seven days it is negative at minus 5.1 per cent. The sequence describes a decline that has reversed on the quarter but is no longer carried by the most recent weeks.
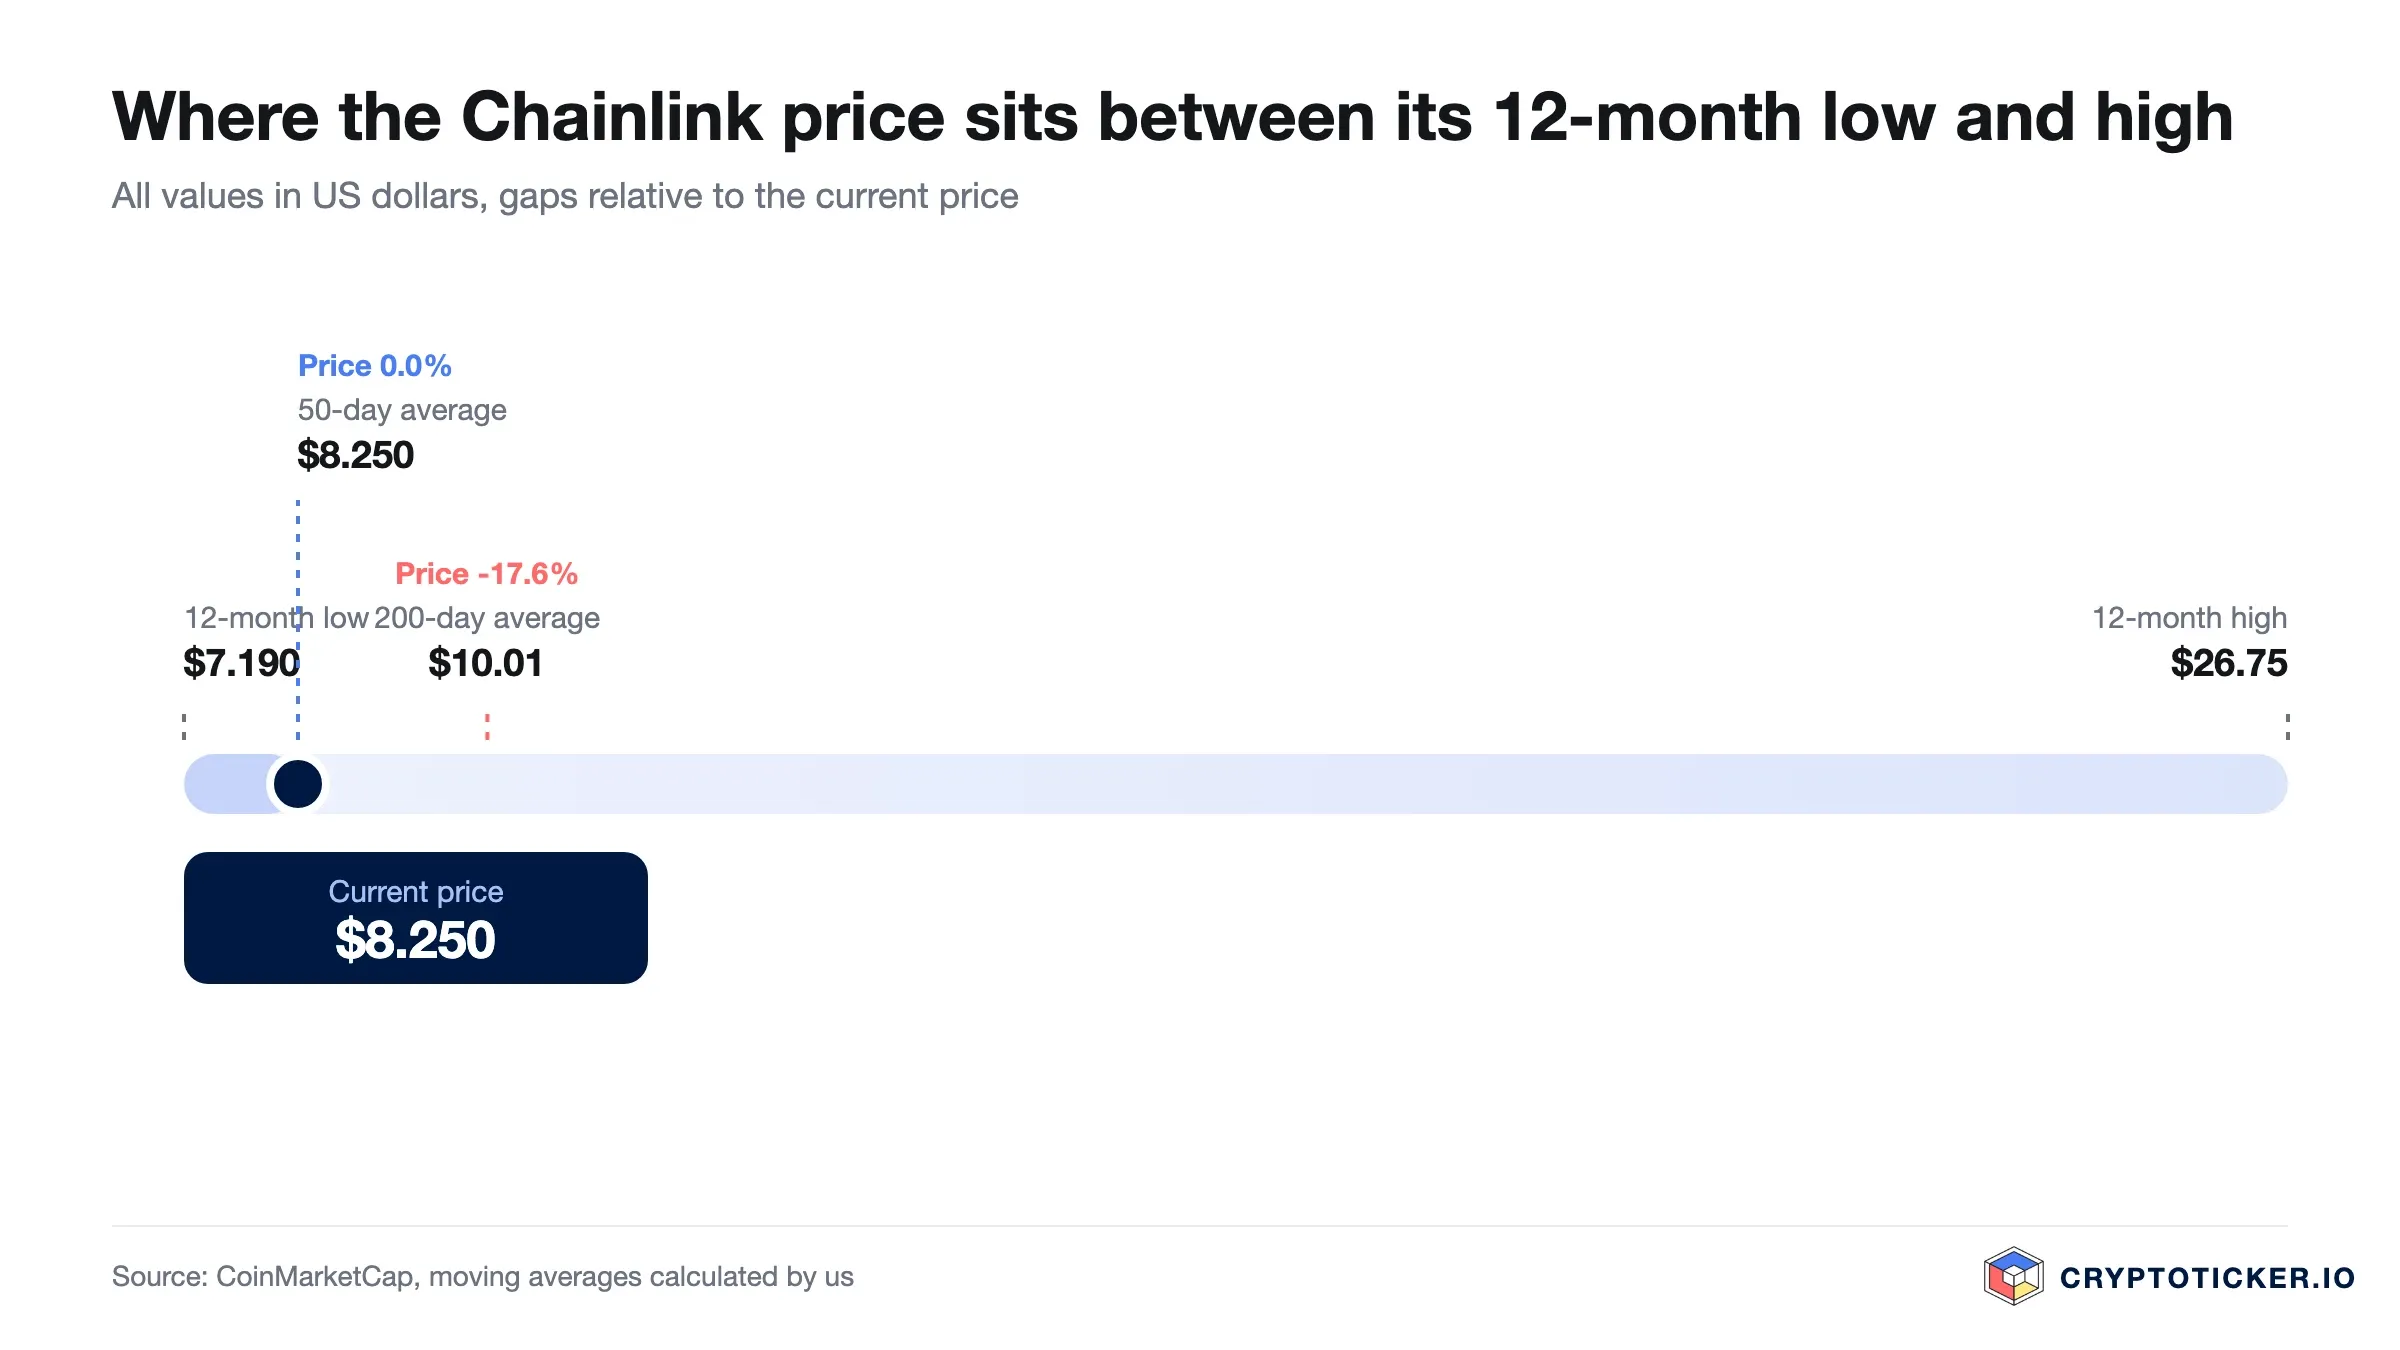
A downtrend is generally considered broken when a market stops setting lower highs and reclaims its longer-term average. Chainlink met the first condition in July: the low of 7.19 USD was not undercut, and each subsequent pullback ended higher. The second condition was met in September. The price trades 10.0 per cent above the 200-day average of 10.95 USD, the 50-day average sits above it, and both are rising, so the advance from 7.19 USD no longer reads as a move within a falling market — even though the price has now dropped back below that 50-day line.
The trend is therefore broken rather than interrupted on the long line, even though the past fortnight has taken the price back below the short one. That distinction defines what would have to happen for the picture to change again: several daily closes below 10.95 USD would put the break back in question, while a close below 7.19 USD would confirm that the summer stabilisation was only a pause in a continuing decline.
What RSI and moving averages mean for a Chainlink entry
The 14-day relative strength index stands at 41.3, in the lower half of the scale but still clear of the oversold threshold of 30 and far from the overbought threshold of 70. For an entry decision the reading offers neither the discount of a washed-out market nor the warning of an overheated one. What is notable is that the indicator has given back almost 15 points since 6 October, from 56.0 to 41.3, while the price fell 13 per cent: the upward momentum is gone. Buyers at 12.05 USD are paying a price that momentum indicators describe as neither full nor cheap.
The moving averages are more layered. The 200-day exponential average at 10.95 USD lies below the current price, while the 50-day at 12.46 USD now lies above it. The simple averages sit at 12.62 USD over 50 days and 9.78 USD over 200 days; the gap between the simple and the exponential 200-day figure shows how much weight last autumn's losses still carry.
A market trading above its long-term average but below its short-term one has settled only half of that question, which is not the same as a timing signal. The technical picture supplies boundaries rather than entries: below 12.46 USD the short-term advance is in question, which is exactly where the price now sits, and below 10.95 USD the trend break itself would have to be reassessed. A buyer at 12.05 USD accepts a tenth of downside before that second line is reached.
What Chainlink trading volume reveals about demand
Chainlink turned over 370.6 million USD in the past 24 hours, alongside a 5.1 per cent decline over the week and minus 3.1 per cent against the last daily close of 12.43 USD. The two September outliers that distorted the monthly figure at our last update have dropped out of the 30-day window; the average now stands at 489.7 million USD and is shaped by three smaller outlier sessions on 26, 29 and 30 September, when 927 million, 1.38 billion and 868 million USD changed hands. Excluding those three the monthly average is 426.4 million USD and the median 417.2 million USD.
The longer averages put that in context. Over 90 days Chainlink averaged 499.4 million USD in daily turnover, and over the full year 455.2 million USD. The adjusted monthly figure of 426.4 million USD now sits 6.3 per cent below the yearly mean, where at our last update it was about 14 per cent above it: the sign has flipped. The latest session is no better: at 370.6 million USD it sits below both the yearly mean and the 90-day average.
Read together, the figures still support the case that the July low attracted real buyers rather than a technical bounce. What the most recent stretch does not support is the advance since: the seven-day average of 290.0 million USD is 40.8 per cent below the monthly average and below the 90-day average of 499.4 million USD, the very level we named as the test of whether demand carries the advance. On that measure the last few weeks of the move are thinly backed, and the gap has widened since our last update.
Structural factors that speak for Chainlink: supply mechanics, usage and regulation
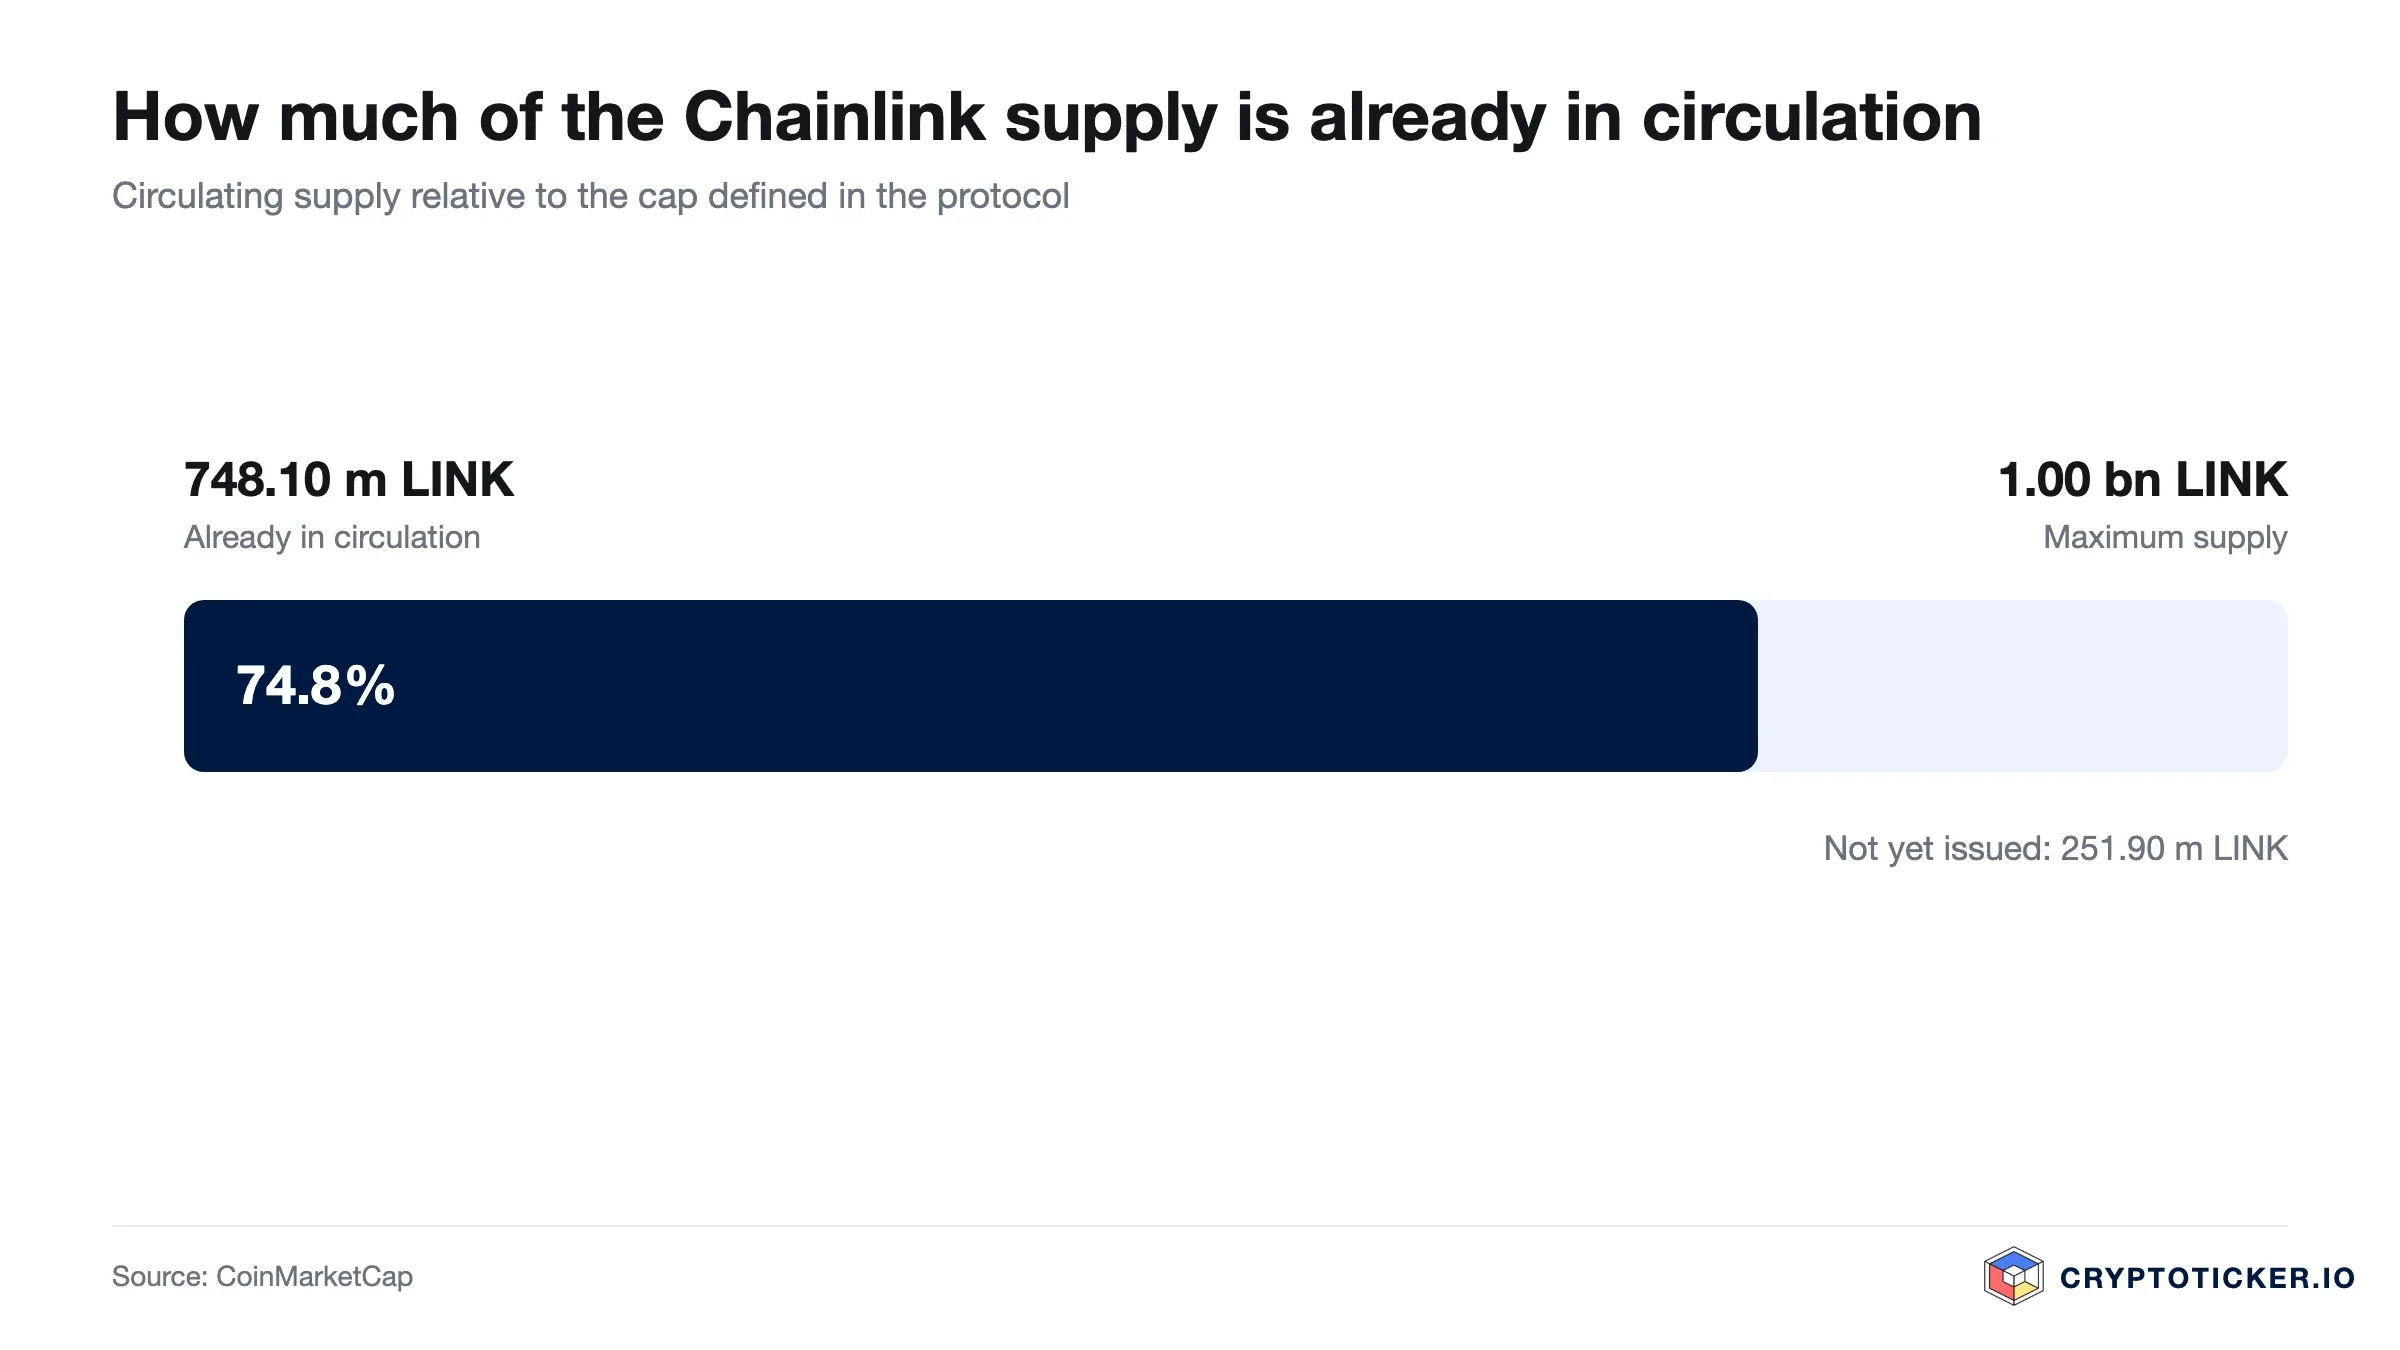
Chainlink's supply is capped at one billion LINK, of which 766.9 million are in circulation, just over 76 per cent. The remainder is released over time to fund node operators and ecosystem growth, so the circulating figure rises gradually. The ceiling is fixed, but the distribution schedule is administered rather than algorithmically final.
The network's function is to deliver external data to smart contracts. Its price feeds serve as reference oracles for a large share of decentralised lending and derivatives protocols, and the cross-chain interoperability protocol extends that role to transfers between blockchains. This is infrastructure demand rather than retail demand, which historically makes it steadier than sentiment but slower to translate into price.
On regulation, the European framework for crypto-asset markets has been in force since 2024 and is supervised by the European Securities and Markets Authority. It brings licensing requirements for exchanges and custodians rather than rules aimed at individual tokens, so the effect for LINK holders in Europe is a more regulated set of venues.
What speaks for buying Chainlink at current prices
First, the range has held and then broken upwards. The low of 7.19 USD was tested once and has not been revisited since, and the price still sits 67.5 per cent above it. A defined floor allows a position to be sized against a specific invalidation level, even one this far away.
Second, the discount to the 12-month high is still substantial. At 12.05 USD, Chainlink trades 35.4 per cent below the high of 18.66 USD. Investors who expect the network's role as an oracle provider to persist are buying below the level the market paid a year ago.
Third, the trend structure has turned and the averages have held their order. The 50-day average of 12.46 USD sits 13.8 per cent above the 200-day average of 10.95 USD and both are still rising, even though the price has slipped below the shorter line. That configuration has historically been a more favourable starting point than buying into falling averages, though it says nothing about timing.
What speaks against buying Chainlink at current prices
First, most of the move has already happened and is now reversing. A gain of 46.0 per cent over 90 days and 10.7 per cent over 30 days, but a loss of 5.1 per cent over the past week and 22.0 per cent from the September high of 15.44 USD, means buyers at 12.05 USD are paying after the advance, not before it, and over twelve months the loss of 33.3 per cent still stands.
Second, the nearest support has already given way. The 50-day average of 12.46 USD now lies 3.3 per cent ABOVE the current price, so the first support beneath is the 200-day average of 10.95 USD, 10.0 per cent under it. The line our last update named as the nearest level at which to concede the position no longer holds, and the next one is a tenth lower.
Third, the entry offers no technical edge. With the RSI at 41.3 there is still no oversold discount on offer, and the 12-month low of 7.19 USD lies 40.3 per cent below the current price. Anyone buying now is expressing a view about the network rather than acting on a chart signal.
How to buy Chainlink at current prices: costs, custody and providers
LINK is listed on all major regulated European exchanges, so the decision is usually about fees and custody rather than availability. Spot fees typically range from about 0.1 per cent on volume-tiered venues to well over 1 per cent on convenience-oriented brokers, and the spread matters as much as the headline fee. Our exchange comparison sets the cost structures side by side, and the overview of regulated exchanges narrows the field to licensed venues.
On individual providers, our Bitpanda review, our Kraken review and our Bitvavo review cover fees, deposit methods and withdrawal conditions. Withdrawal terms deserve attention if you intend to move LINK off the exchange, because network fees and minimum amounts vary considerably.
Custody is the second decision. Coins left on an exchange remain in that platform's control, which is convenient for trading and a counterparty risk for holding. A hardware wallet moves the keys into your own hands at the cost of responsibility for the recovery phrase; our hardware wallet comparison covers the current devices. LINK can also be staked for a yield in return for a lock-up, and the staking platform comparison shows the terms. Conditions change, so check them with the provider before every purchase.
So is Chainlink a good buy at current prices, short-term and long-term
For the short term, the technical picture has cooled further and one piece of it has broken. At 12.05 USD, with the RSI down to 41.3, turnover below the yearly mean and the price now below the 50-day average, a buyer is entering after the move and after its first reversal. The levels that would resolve the question are known: reclaiming the 50-day average of 12.46 USD would put the advance back on track, a drop below the 200-day average of 10.95 USD would put the trend break back in question, and a close below 7.19 USD would end it.
For the long term, the question is whether demand for oracle infrastructure grows faster than the remaining 23 per cent of supply enters circulation. Chainlink's price feeds and cross-chain protocol are used across decentralised finance, and that usage has held up better than the token price. An investor who expects the gap to close is buying an established network 35.4 per cent below its 12-month high. One who expects token value to stay loosely coupled from usage has no reason to act at 12.05 USD either.
The assumption behind the constructive case is that the low of 7.19 USD marked the end of the decline. It should be treated as refuted if Chainlink closes a week below the 200-day average of 10.95 USD, or if the price falls back into the summer range while the adjusted 30-day volume average slips under the yearly mean of 455.2 million USD. The second half of that second condition has now arrived: the adjusted 30-day average of 426.4 million USD sits below the yearly mean, while the price is still well clear of the summer range. Both are observable conditions rather than matters of opinion. Our Chainlink price prediction follows the same levels as they develop.
Buying Chainlink: what to take away
- Chainlink trades at 12.05 USD, below its 50-day average of 12.46 USD but above its 200-day average of 10.95 USD, 67.5 per cent above the 12-month low of 7.19 USD and 35.4 per cent below the high of 18.66 USD. The 50-day average sits above the 200-day one and both are rising, so the downtrend is broken rather than merely slowed, but the short-term support has gone. Ongoing analysis is in our Chainlink price prediction.
- The RSI of 41.3 gives no entry signal, and adjusted 30-day volume of 426.4 million USD has slipped below the yearly average of 455.2 million USD, while the seven-day average of 290.0 million USD shows participation thinning out further. That argues for position sizes that survive a retest of 10.95 USD, a tenth below the current level. Fees are compared in our exchange comparison.
- The structural case rests on a fixed cap of one billion LINK with 766.9 million in circulation and on oracle demand that has held up better than the price. If you buy, decide on custody at the same time. Our hardware wallet comparison covers the options.
Disclosure: Some of the providers mentioned in this article work with us through partner programmes. This has no influence on the price analysis or the assessment of the chart situation; the price data comes from a public market data source and can be verified there.
(As of 15 October 2026. This article is not investment advice. Prices, fees and conditions change; check them with the provider before every purchase. Crypto assets are subject to high price volatility, and a total loss is possible.)
Transparency note: This article was produced with the assistance of artificial intelligence and reviewed by our editorial team before publication. All figures and claims were checked against the primary sources linked in the text. The feature image was generated with AI.
Which topics should we dive deeper into?
Select what genuinely interests you. Your picks feed directly into our editorial planning.
Crypto news that's actually worth your time.
Weekly. 60 seconds. Carefully curated by our editors: no hype, no promo flood, no spam.
More from CryptoTicker