
Is Avalanche a Good Buy at Current Prices?
Avalanche trades above both moving averages and has held the September breakout, with the RSI back out of overbought territory. What the chart, RSI and supply mechanics mean for a possible entry. What speaks for buying at the current price - and what against it.




Which topics should we dive deeper into?
Select what genuinely interests you. Your picks feed directly into our editorial planning.
Crypto news that's actually worth your time.
Weekly. 60 seconds. Carefully curated by our editors: no hype, no promo flood, no spam.
Avalanche trades at 10.91 US dollars, 62.1 percent below the twelve-month high of 28.82 dollars set on 9 October 2025. Anyone opening the chart today sees an asset that fell for most of the past year, moved sideways through the summer, broke out in September and has held that breakout since. The question here is narrow: is Avalanche a good buy at current prices, or has that move already taken what the recovery had to give?
cryptoticker.io collected the price data for this article itself, as of 8 October 2026. The moving averages, the relative strength index and the twelve-month extremes were calculated by us from 365 daily closing prices using standard formulas: exponential moving averages over 50 and 200 days, and a 14-period RSI with Wilder smoothing. Market capitalisation, supply and volume are as of the same date. Anything beyond the arithmetic is our own reading and is marked as such.
Avalanche price analysis: where the AVAX price stands and which levels matter now
The AVAX price of 10.91 dollars has cleared both levels that defined the first half of the year. The twelve-month low of 5.89 dollars, printed on 20 June 2026, now lies 46.0 percent below spot. The 200-day exponential moving average at 8.96 dollars, for months the ceiling, sits 17.9 percent below the price, and the 50-day exponential moving average has caught up to 9.23 dollars, 3.0 percent above the 200-day line and 15.4 percent below spot.
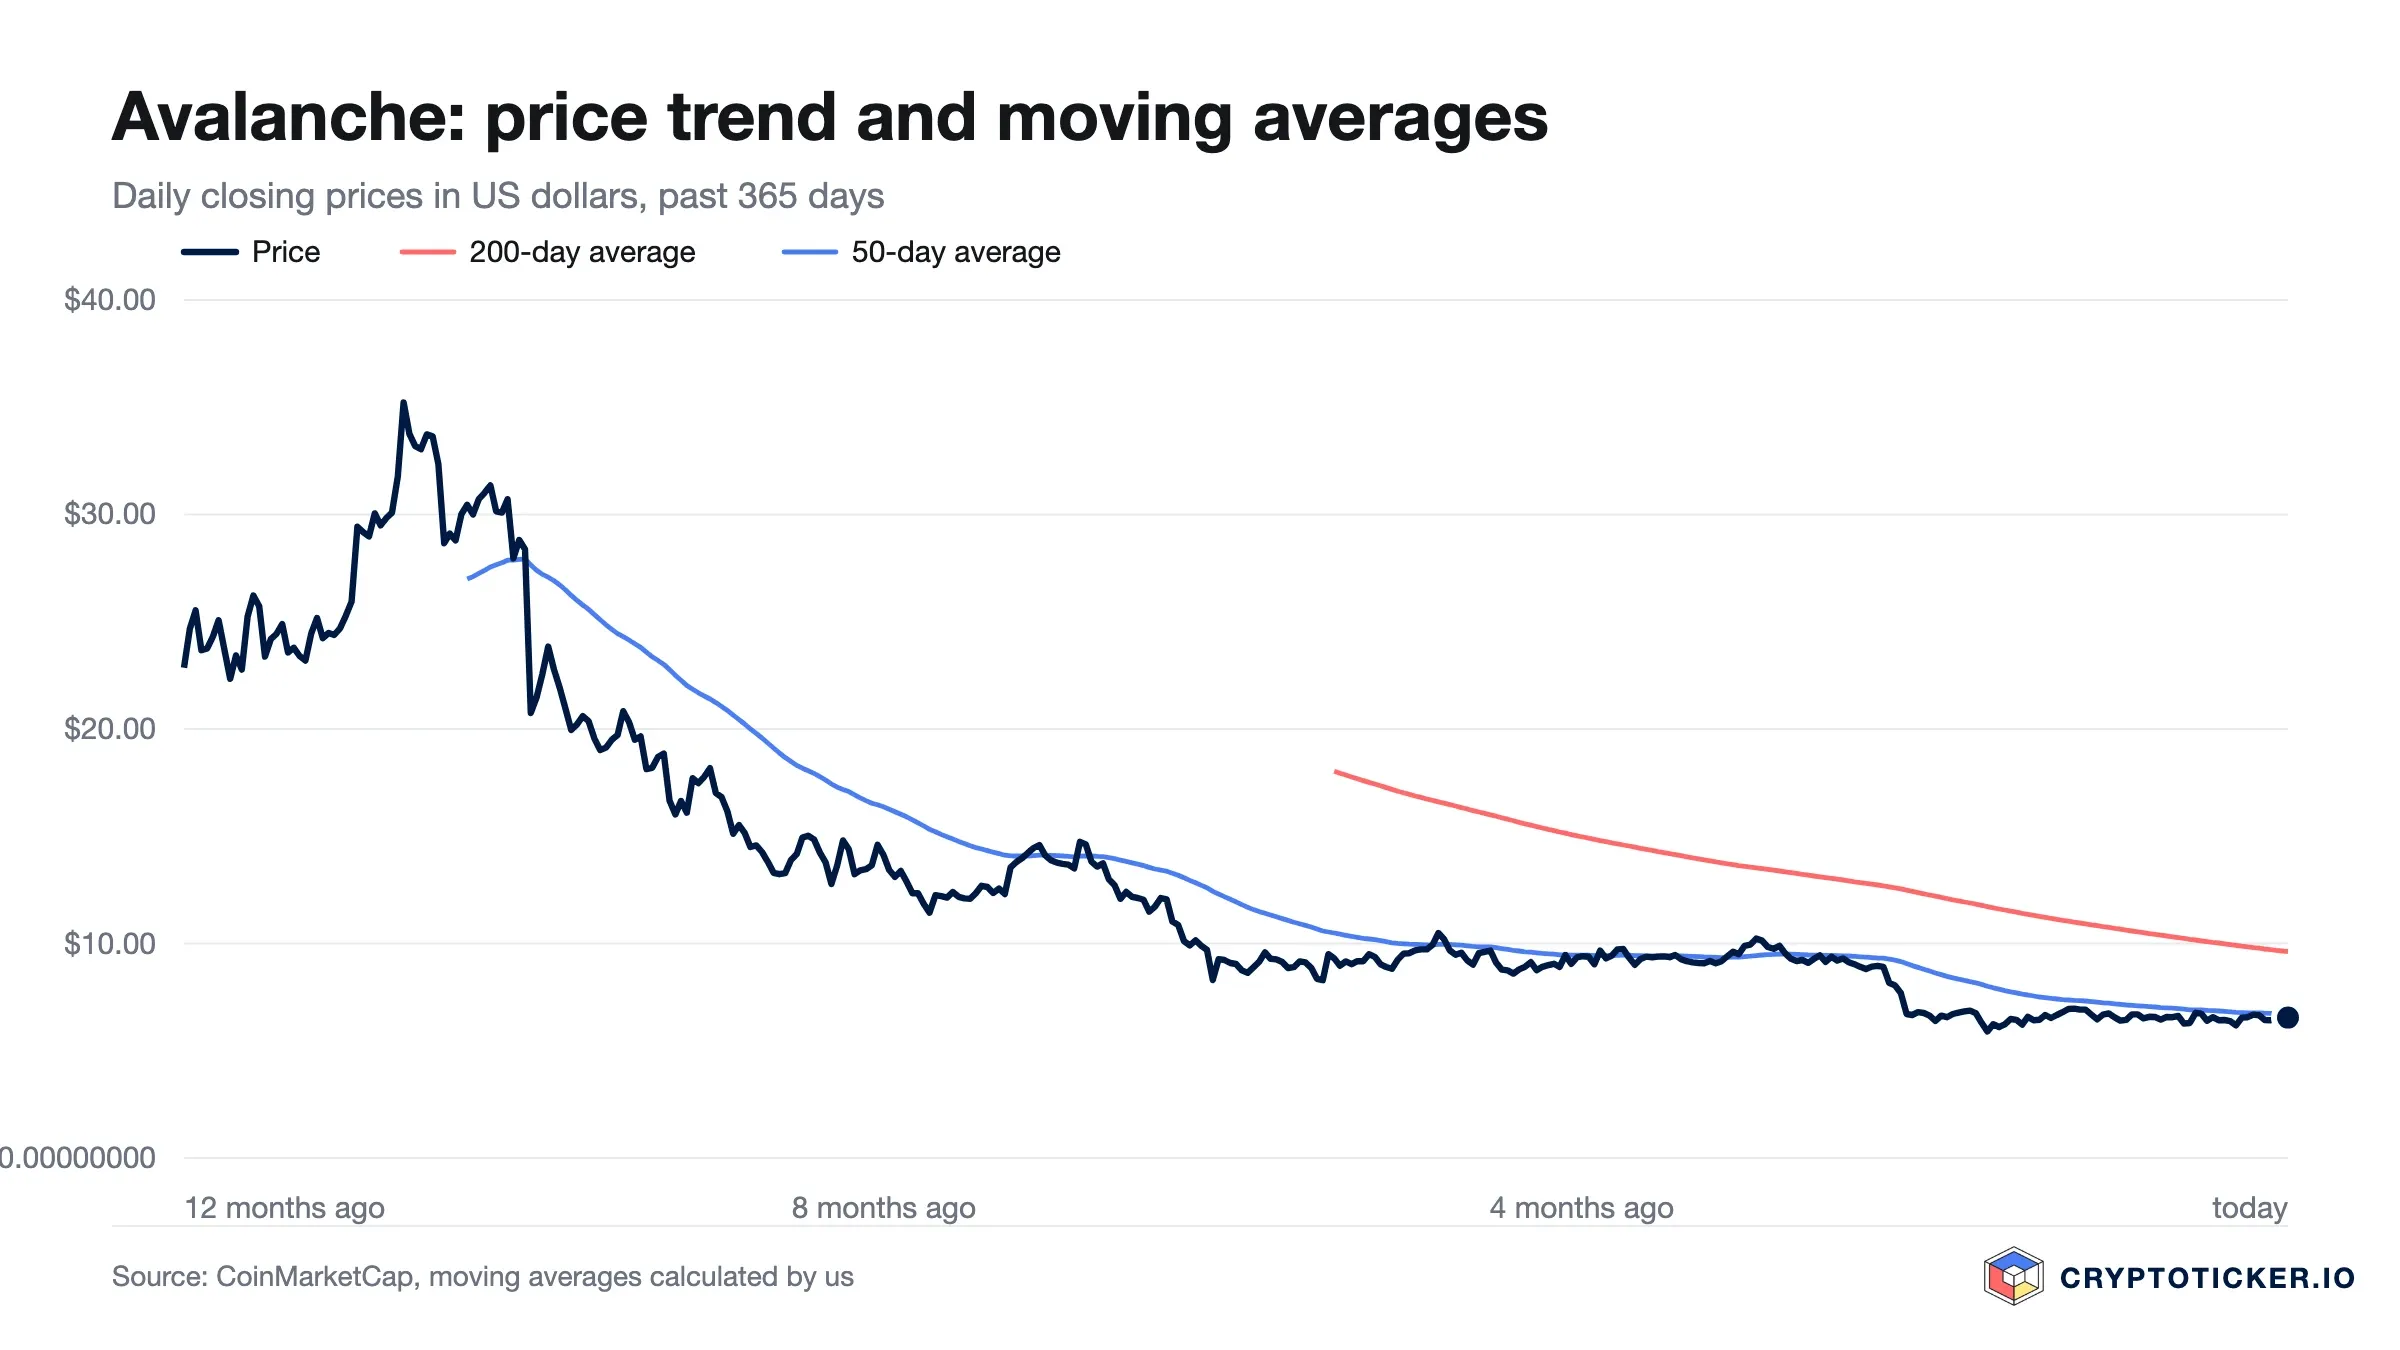
A market trading above every one of its reference levels has stopped falling, which is not the same as being cheap. The simple averages agree with the exponential ones: the 200-day SMA stands at 8.11 dollars and the 50-day SMA at 8.79 dollars, both below the current price.
For anyone weighing an entry the practical levels are 8.96 dollars on the downside and 11.60 dollars, the highest daily close of this move, on the upside. A daily close back below the 200-day average would put the breakout in question. Holding above it keeps the turn that began in September intact. Our Avalanche price prediction tracks how these levels have shifted through the year.
Is the Avalanche downtrend broken or only interrupted?
On the evidence available on 8 October 2026 the downtrend is broken rather than merely interrupted. Over twelve months AVAX is still down 62.1 percent, measured against a closing price of 28.82 dollars on 9 October 2025. Over 90 days, however, the price is up 63.4 percent and over 30 days 35.1 percent, while the past week took 0.2 percent back off. The direction has reversed on every horizon shorter than a year, and the past week shows the move pausing rather than extending.
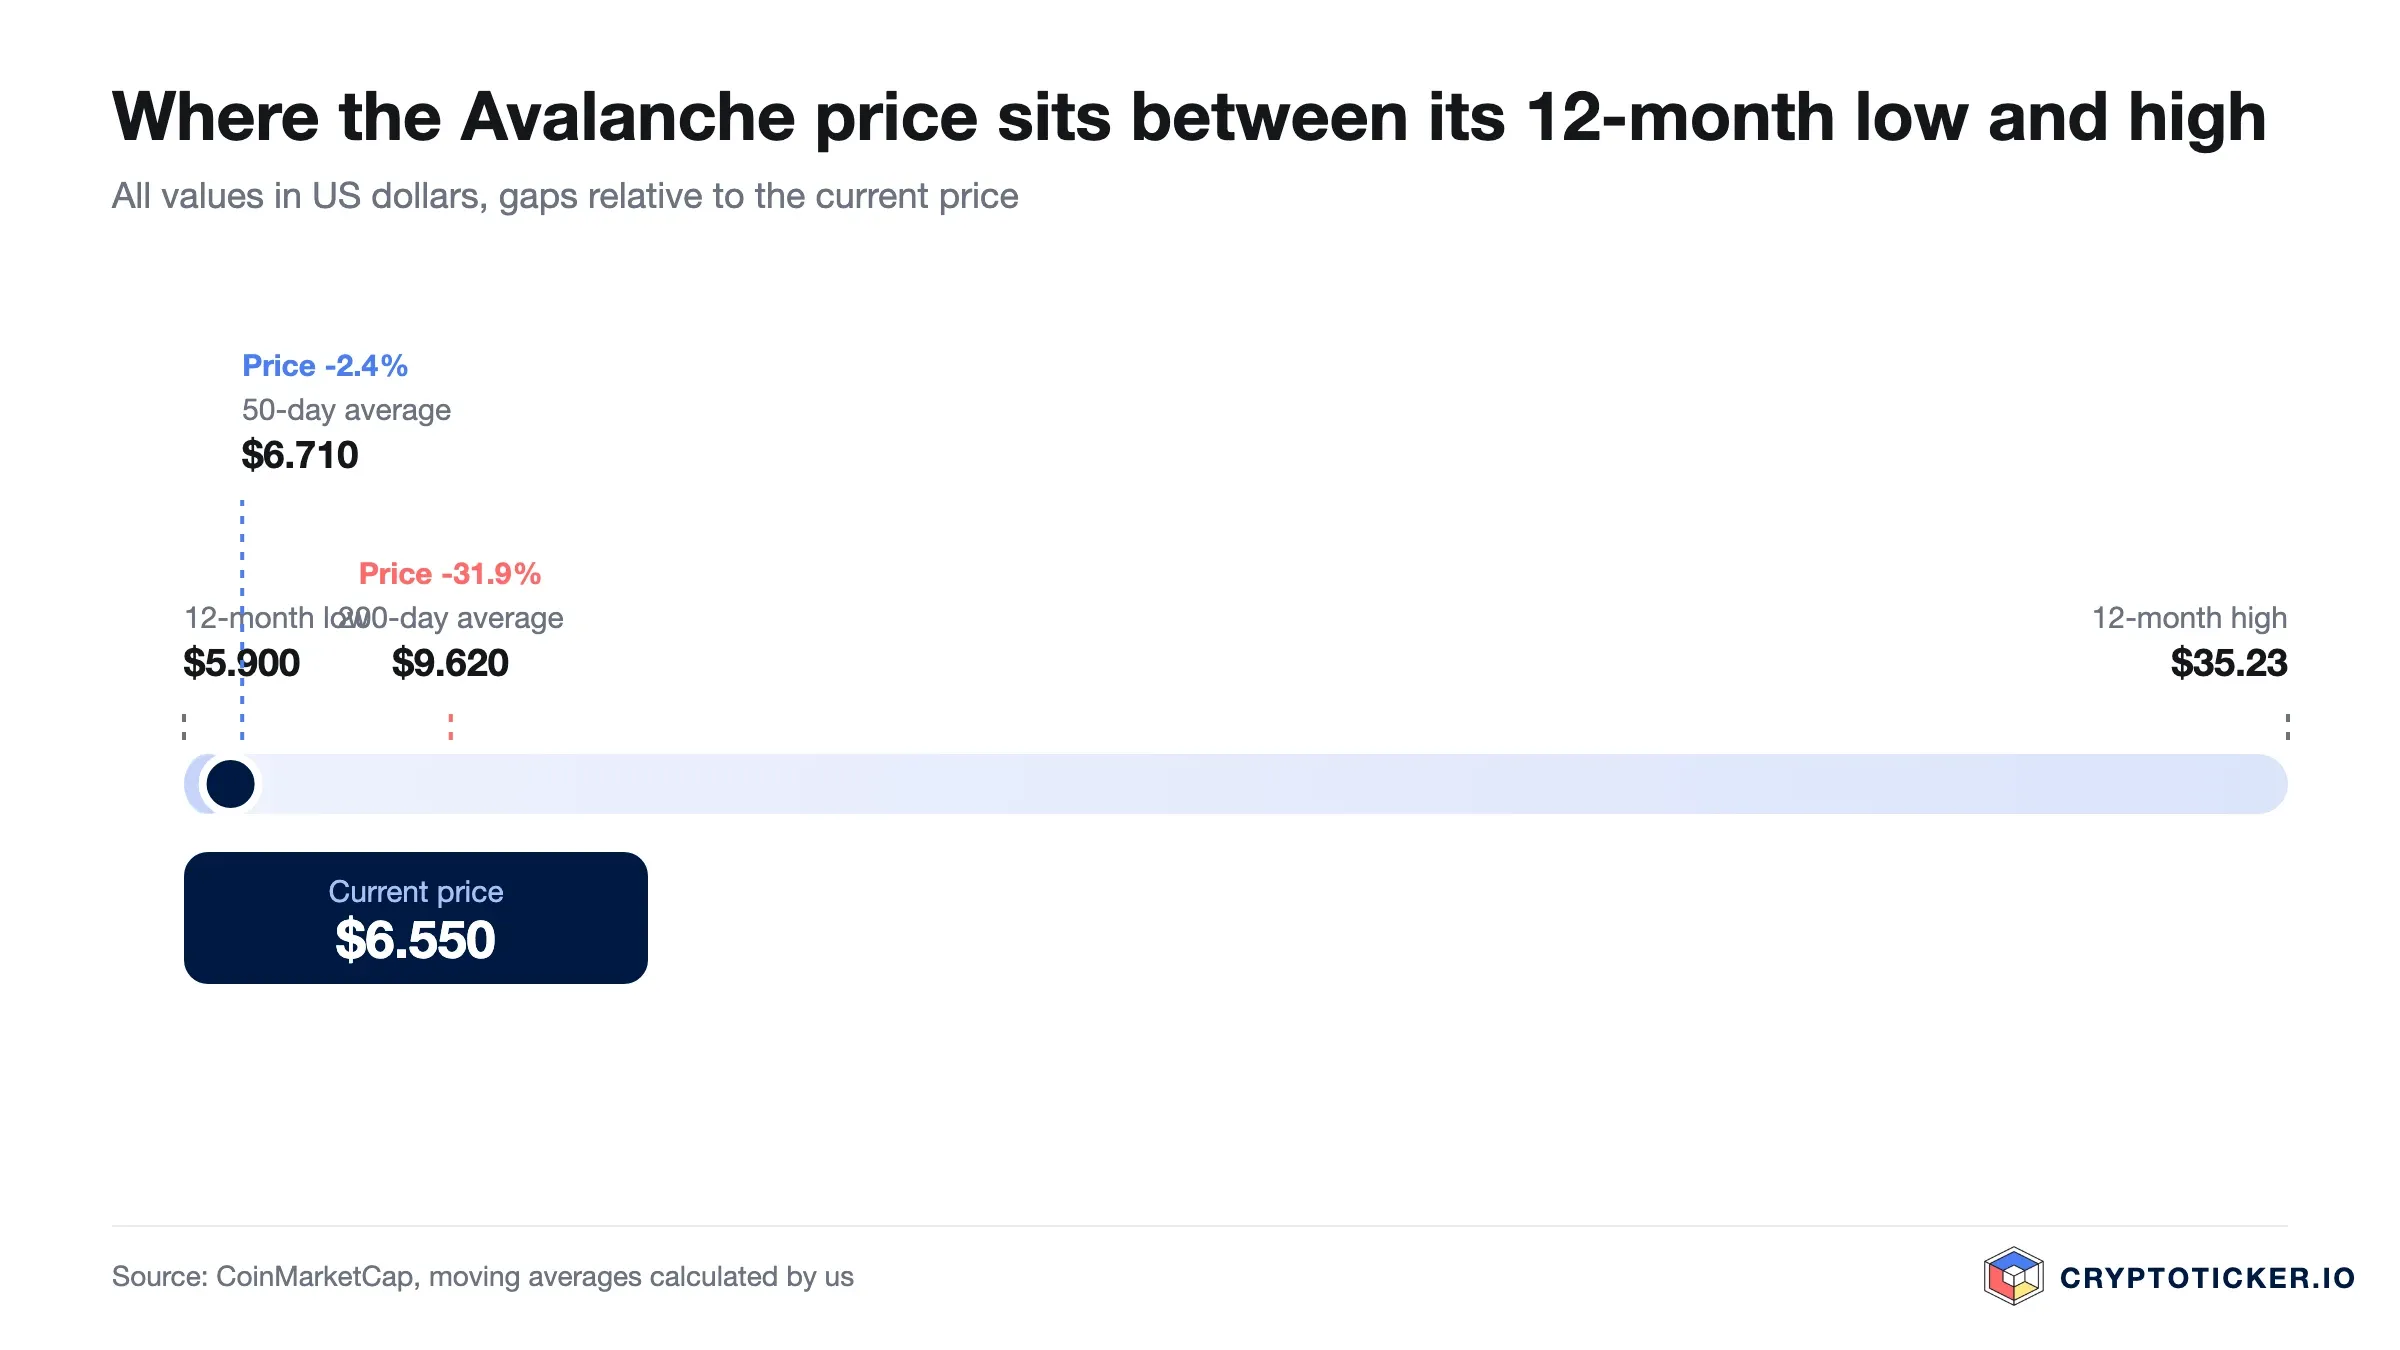
A broken downtrend requires a higher low followed by a higher high on the daily chart, confirmed by a reclaim of the shorter average. Avalanche has produced all three: the June bottom at 5.89 dollars has held for three and a half months, the daily close of 11.60 dollars on 7 October is the highest since February, and the 50-day EMA at 9.23 dollars was reclaimed well before the breakout.
Our assessment is that AVAX has left the accumulation phase and is now in the stage where a breakout either consolidates or gives its gains back. The past two weeks look like the first of those: the price has held its range between 10.61 and 11.60 dollars without making new ground. What would settle it is specific: weekly closes holding above the 200-day EMA at 8.96 dollars would confirm the turn, while a weekly close back below the 50-day EMA at 9.23 dollars would mark the move as a failed breakout.
What RSI and moving averages mean for an Avalanche entry
The 14-day RSI reads 59.0. Readings below 30 mark the oversold conditions that often precede bounces; readings above 70 mark the overbought conditions that precede corrections. At 59.0 Avalanche is in neither category. The indicator stood above 70 in the middle of September and has worked its way back without the price falling, which is how an advance digests an overbought reading.
The constructive reading is that momentum has cooled while the price held, the pattern that distinguishes a consolidation from a top. The discouraging reading is that a neutral-to-firm RSI offers a buyer no edge either: it marks a market that is neither cheap nor stretched.
The averages add the structural layer. With the price at 10.91 dollars above both the 50-day EMA at 9.23 dollars and the 200-day EMA at 8.96 dollars, the medium-term configuration has turned constructive. The distance to the 50-day average, 18.3 percent, is the caveat: gaps of that size usually close through a pause or a pullback rather than through further acceleration, and only part of that has happened.
What Avalanche trading volume reveals about demand
Volume is the demand signal price alone cannot provide, and it has stayed elevated. Turnover over the past 24 hours came to 549.7 million dollars. The 30-day average is 521.9 million, the 90-day average 302.7 million and the 365-day average 331.3 million. Activity now runs slightly above the monthly average, and that monthly average is itself 72 percent above the quarterly one.
One reading is constructive: a price move carried by turnover of this size reflects real participation, and unlike in September the participation has persisted for weeks rather than a session. The other is discouraging: the seven-day average of 439.4 million dollars is 15.8 percent below the 30-day figure, so the elevated turnover has already begun to ease, and no such level is permanent.
The ratio of volume to market capitalisation offers a partial check. Against a capitalisation of 4.84 billion dollars, daily turnover of 549.7 million means roughly 11 percent changed hands in a day. Our assessment is that the participation problem of the summer has been resolved rather than merely eased, and that the test is whether turnover stays above the 90-day average of 302.7 million rather than falling back to it.
Structural factors that argue for Avalanche: supply, usage, regulation
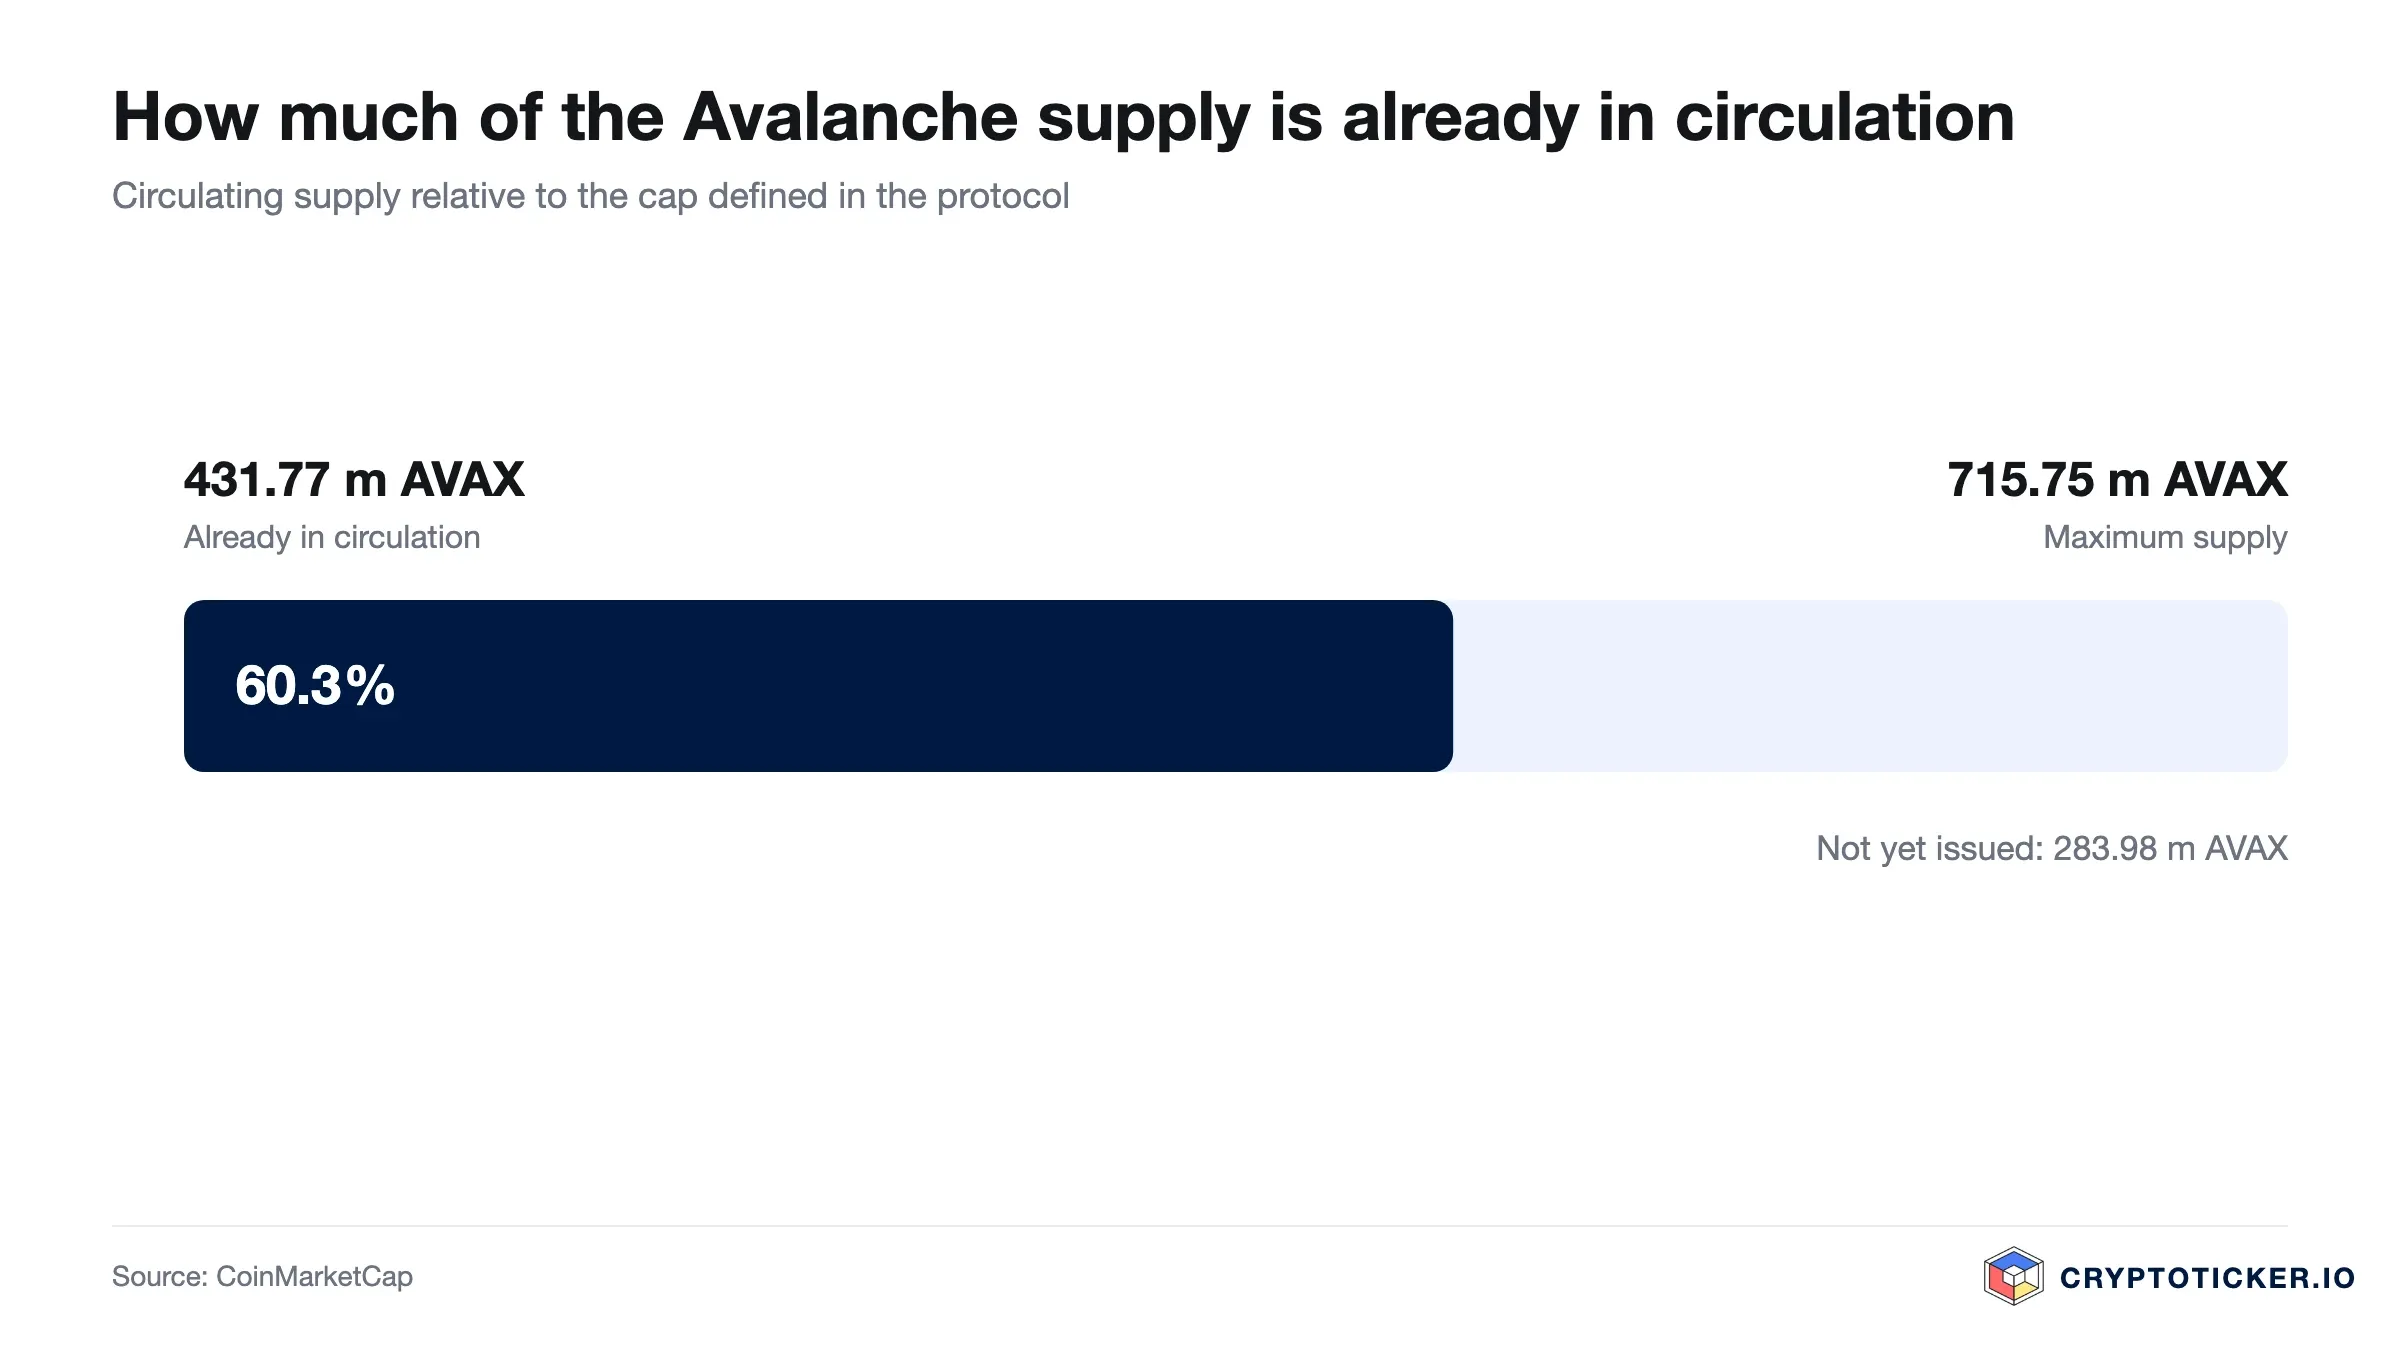
Three structural features distinguish AVAX from a chart pattern. The first is supply mechanics. Circulating supply stands at 443.3 million AVAX against a hard maximum of 720,000,000, so roughly 62 percent of the eventual total is in the market. Avalanche also burns the base fee on every transaction, permanently removing tokens, and the documentation at docs.avax.network sets out both the cap and the burn.
The second is the subnet architecture. Avalanche lets independent chains run under their own rules while settling to the primary network, and validators must stake AVAX to take part. That creates demand tied to network usage rather than to speculation. How much depends on how many subnets attract real activity, which is an open question rather than a settled fact.
The third is regulatory position. AVAX trades on regulated European venues under the MiCA framework, and the European Securities and Markets Authority publishes the supervisory guidance governing those venues. Investors who intend to stake rather than hold will find the mechanics compared in our staking rewards platform comparison.
What argues for buying Avalanche at current prices
Three arguments carry weight at 10.91 dollars.
First, the valuation. A market capitalisation of 4.84 billion dollars for the 26th-largest crypto asset still prices Avalanche as an also-ran. If the subnet architecture delivers even part of what it promises, that figure is low against the network's technical position. The argument is conditional and rests on adoption that has not yet happened.
Second, the price structure. The June low at 5.89 dollars has held for three and a half months, and the breakout has cleared both moving averages on turnover that has stayed high. A buyer at 10.91 dollars has a defined invalidation level in the 200-day average at 8.96 dollars, 17.9 percent below the entry.
Third, the asymmetry of the discount. At 62.1 percent below the twelve-month high of 28.82 dollars, a large part of the disappointment is still in the price even after the rally. The scenarios that take AVAX substantially lower require the network to lose relevance outright, whereas the levels that capped the market through the first half of the year lie far above the current price.
What argues against buying Avalanche at current prices
Three arguments cut the other way.
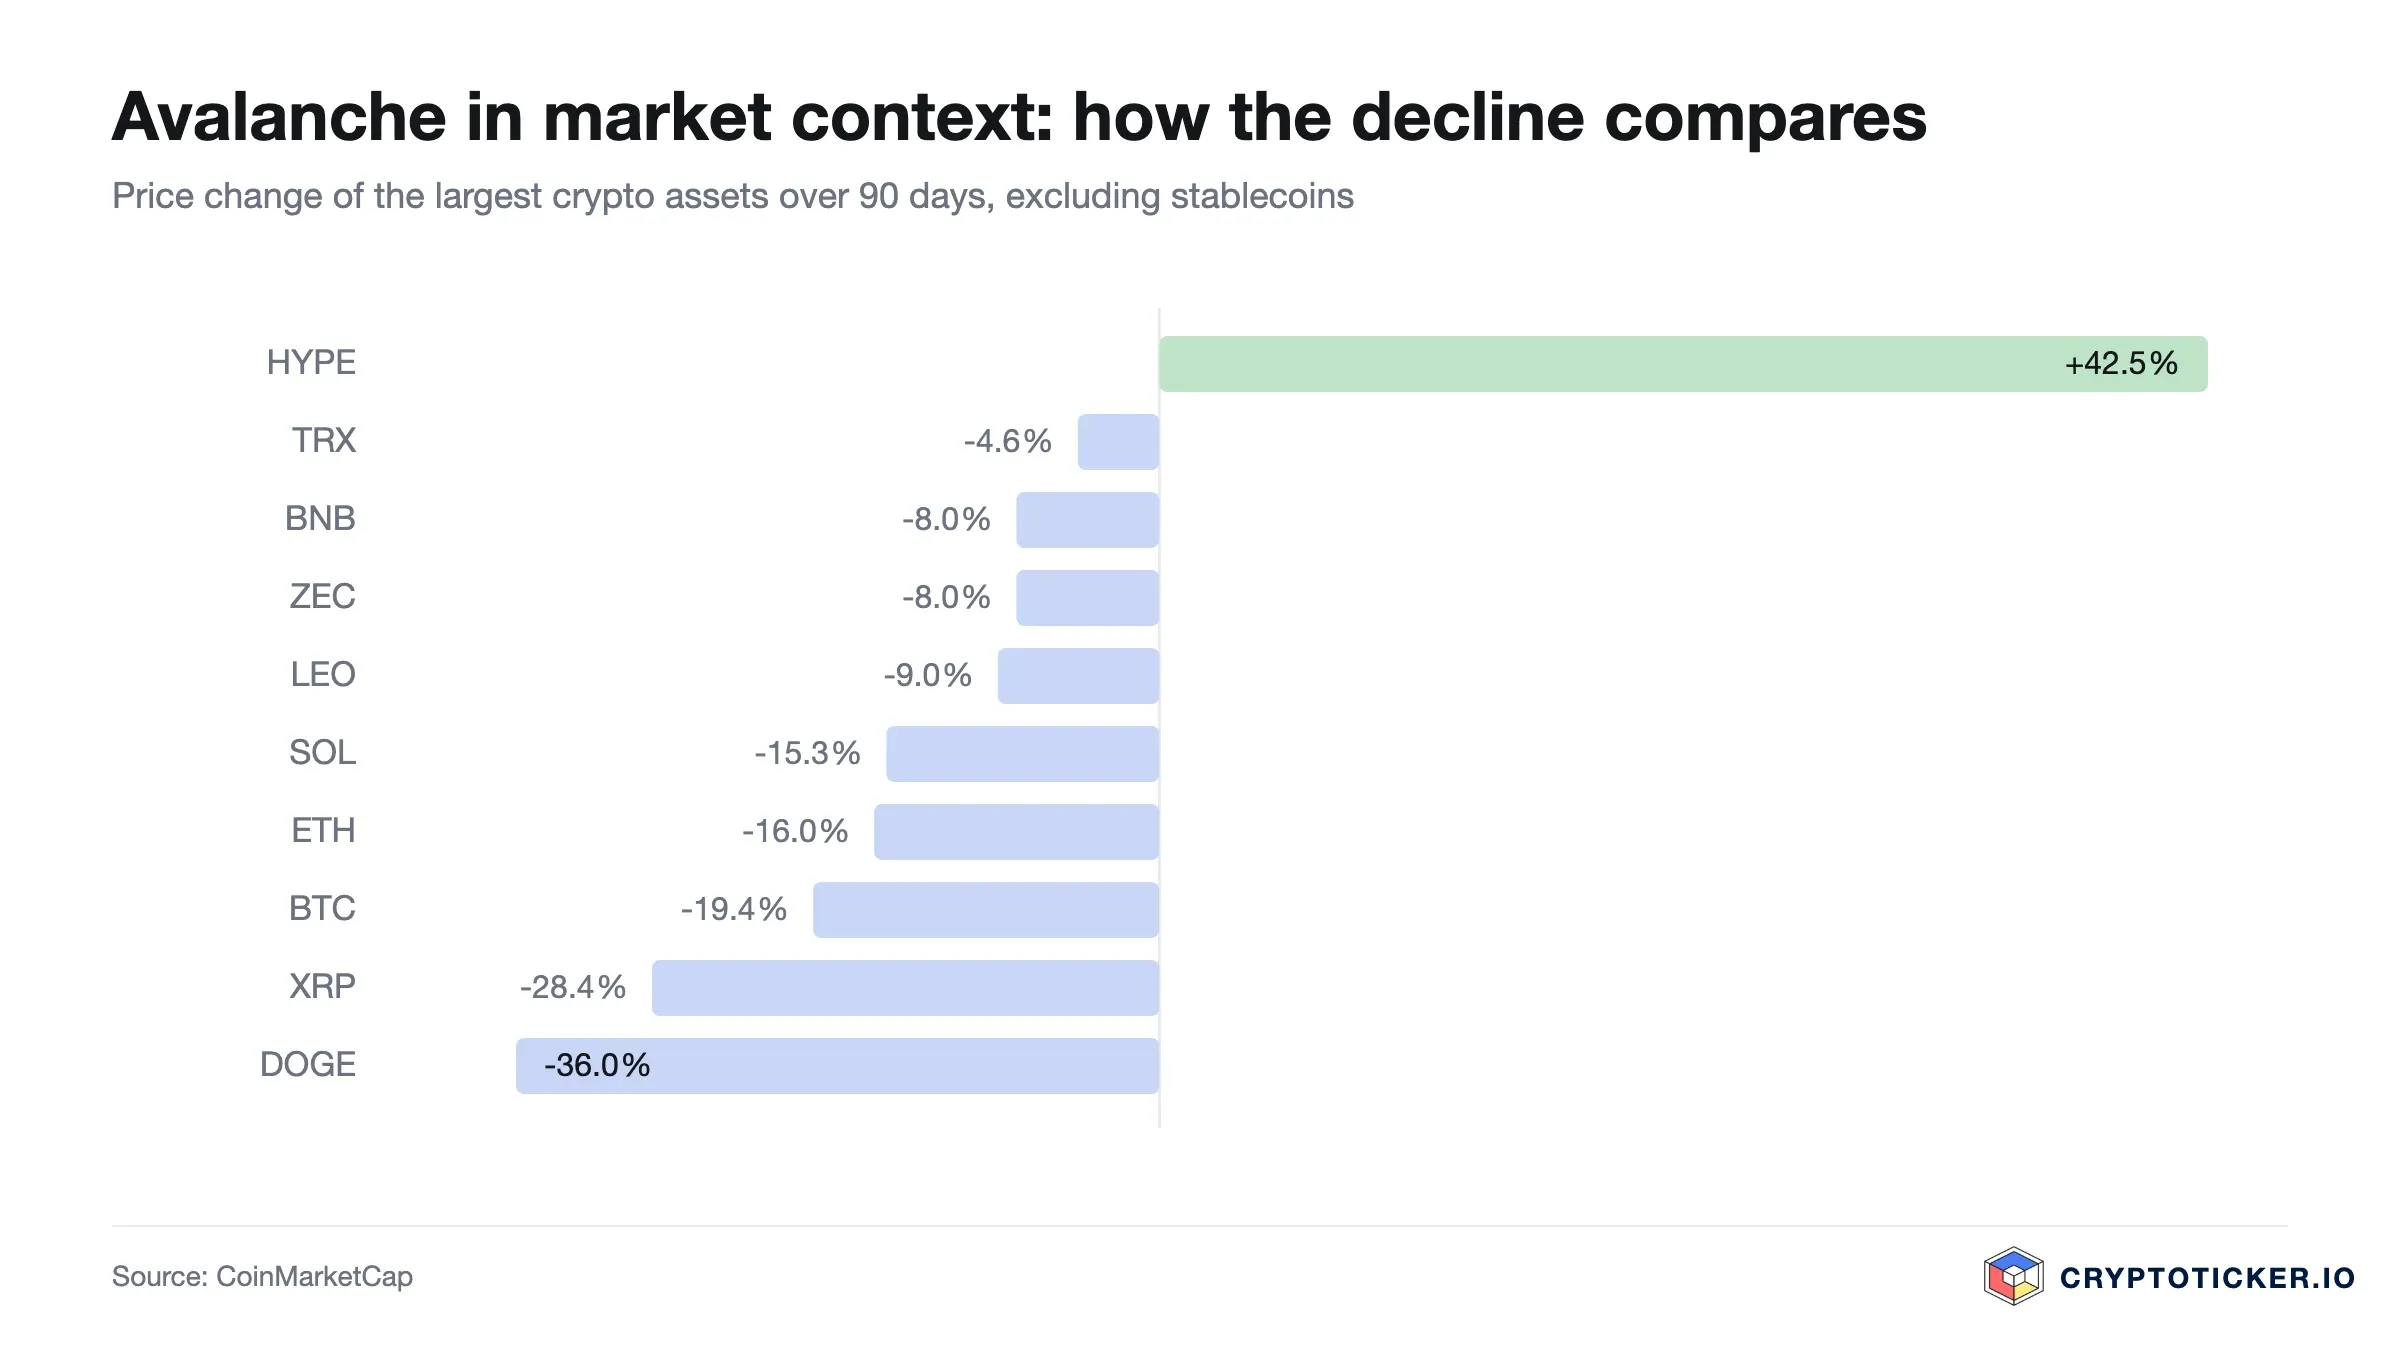
First, the move has already happened. Up 63.4 percent over 90 days and 35.1 percent over 30 days, AVAX is being bought after a year in which every rally since October 2025 was sold. A buyer at 10.91 dollars is paying close to the highest price of the past eight months for an asset still down 62.1 percent over twelve months, and the past week took 0.2 percent back off.
Second, the supply overhang. With 443.3 million AVAX circulating and 720.0 million eventually issuable, some 277 million tokens are still to come. Fee burning offsets part of that, but at current transaction volumes only a small fraction. Fresh supply arriving once the current demand fades is arithmetic rather than sentiment.
Third, the distance to any tested support. Turnover of 549.7 million dollars against a 90-day average of 302.7 million is healthy, but below the price there is nothing tested between the two moving averages between 8.96 and 9.23 dollars and the June low at 5.89 dollars. A pullback has room to run before it meets a level that has held.
How to buy Avalanche at current prices: costs, custody, providers
Spot trading fees on regulated European exchanges typically run between 0.1 and 0.5 percent per trade, and the spread on AVAX adds a cost that is rarely quoted. On a 1,000 euro position the gap between a cheap and an expensive venue is usually 5 to 20 euros per round trip. Our crypto exchange comparison sets the current fee schedules side by side.
The regulatory status of the venue is the second filter. Platforms operating under MiCA authorisation carry disclosure and custody obligations that offshore venues do not, Our overview of regulated crypto exchanges covers which venues hold which permissions, and we have documented fees and account processes in our Bitpanda review, our Kraken review and our Bitvavo review.
Custody is the third decision and the one most often deferred. AVAX held on an exchange is exposed to that exchange's solvency and security. For a position meant to be held through a multi-year cycle, a hardware wallet removes that exposure at a one-off cost of roughly 60 to 150 euros; our hardware wallet comparison covers the models supporting AVAX. For a position traded within weeks, exchange custody is the pragmatic choice.
So is Avalanche a good buy at current prices?
The answer separates two horizons.
For the short term, meaning weeks to a few months, the evidence has turned and has since settled. The price at 10.91 dollars sits above both moving averages, turnover of 549.7 million dollars is close to the monthly average rather than spiking, and the RSI at 59.0 has come back out of overbought territory without the price giving ground. The overbought warning that stood here in September no longer applies; what remains is that the price stands 18.3 percent above its 50-day average. A trader buying here is paying up into a consolidating move rather than acting on a fresh signal.
For the long term, meaning two years or more, the calculation differs. The entry sits 85.2 percent above a floor at 5.89 dollars that has held for three and a half months and 62.1 percent below the twelve-month high of 28.82 dollars. An investor who believes the subnet architecture will find users is still offered that view at a price far below last year's. That is the shape of a reasonable long-term entry, provided the position is sized so a retest of the 200-day average at 8.96 dollars is survivable.
Our assessment would be wrong under conditions worth stating explicitly. If AVAX closes a week below the 200-day EMA at 8.96 dollars, the breakout has failed and the constructive reading loses its foundation. If supply expands materially while daily volume falls back to the 302.7 million dollar 90-day average, the overhang is winning. If the price clears 11.60 dollars on sustained turnover, the caution about the distance to the averages was too conservative.
Buying Avalanche: what to take away
- Avalanche trades at 10.91 dollars, 85.2 percent above its twelve-month low of 5.89 dollars and 21.8 percent above its 200-day average of 8.96 dollars. The base held for three and a half months; the trend has turned and the turn has lasted. Our Avalanche price prediction tracks the levels that would change that.
- The RSI at 59.0 is back out of overbought territory and turnover is running at the monthly average, so there is no discount at present, only a trend worth watching. Our staking rewards comparison covers earning while you wait.
- Venue and custody decide a meaningful part of the outcome. Compare fees in our crypto exchange comparison and settle custody before the position grows.
Disclosure: Some of the providers mentioned in this article work with us through partner programmes. This has no influence on the price analysis or on our assessment of the chart; the price data comes from a public market data source and can be verified there.
(As of 8 October 2026. This article is not investment advice. Prices, fees and terms change; check them with the provider before every purchase. Crypto assets are subject to high price volatility and a total loss is possible.)
Transparency note: This article was produced with the assistance of artificial intelligence and reviewed by our editorial team before publication. All figures and claims were checked against the primary sources linked in the text. The feature image was generated with AI.
Which topics should we dive deeper into?
Select what genuinely interests you. Your picks feed directly into our editorial planning.
Crypto news that's actually worth your time.
Weekly. 60 seconds. Carefully curated by our editors: no hype, no promo flood, no spam.
More from CryptoTicker