Civic Price Prediction: CVC explodes 600% after Coinbase listing
Civic was a relatively unknown cryptocurrency with a market capitalization fluctuating from $13 million to $17 million throughout the past two years. The digital asset was ranked top 400 or lower on Coinmarketcap before the announcement from Coinbase. On November […]

Civic was a relatively unknown cryptocurrency with a market capitalization fluctuating from $13 million to $17 million throughout the past two years. The digital asset was ranked top 400 or lower on Coinmarketcap before the announcement from Coinbase.
On November 5, Coinbase, the giant US cryptocurrency exchange announced the listing of Civic, Decentraland, and District0x. All three cryptocurrencies saw significant price spikes within hours of the announcement.
The trading volume of CVC spiked from an average of $1 million per 24 hours to a peak of $524 million on November 10 and continues increasing.
Similarly, its price exploded from a low of $0.025 to a peak of $0.153 only several days later. Despite the massive spike, the digital asset continues trading at $0.13 and shows very little signs of weakness.
CVC Price Analysis: Technical Indicators
We need to watch the short-term time frames as the daily chart is clearly in a massive uptrend now. The hourly chart shows Civic price consolidating and losing the uptrend as well as the 12-EMA and the 26-EMA for the first time since November 5.
CVC/USD 1-hour chart – TradingView
The MACD also turned bearish for the first time since the listing announcement. The RSI has cooled off, which is a positive sign for the bulls. Civic price is now looking for the next potential support level which could be $0.122.
Lower than that, we find the 50-SMA at $0.111 as the next strongest support level. On the other hand, if CVC can hold the 26-EMA and see a breakout above the 12-EMA, the high at $0.1725 would become the next price target for the bulls.
CVC Price Analysis: On-chain Metrics
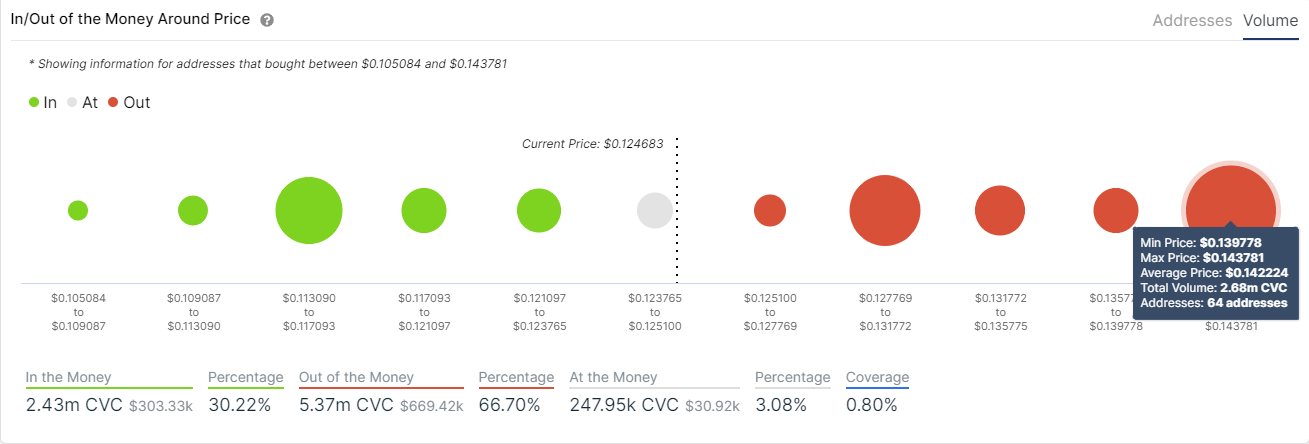
Of course, the IOMAP chart shows a lot of resistance above in comparison to support, which is not surprising considering the magnitude of the rally. The most critical resistance range seems to be located between $0.139 and $0.143 while the strongest support area is established between $0.113 and $0.117.

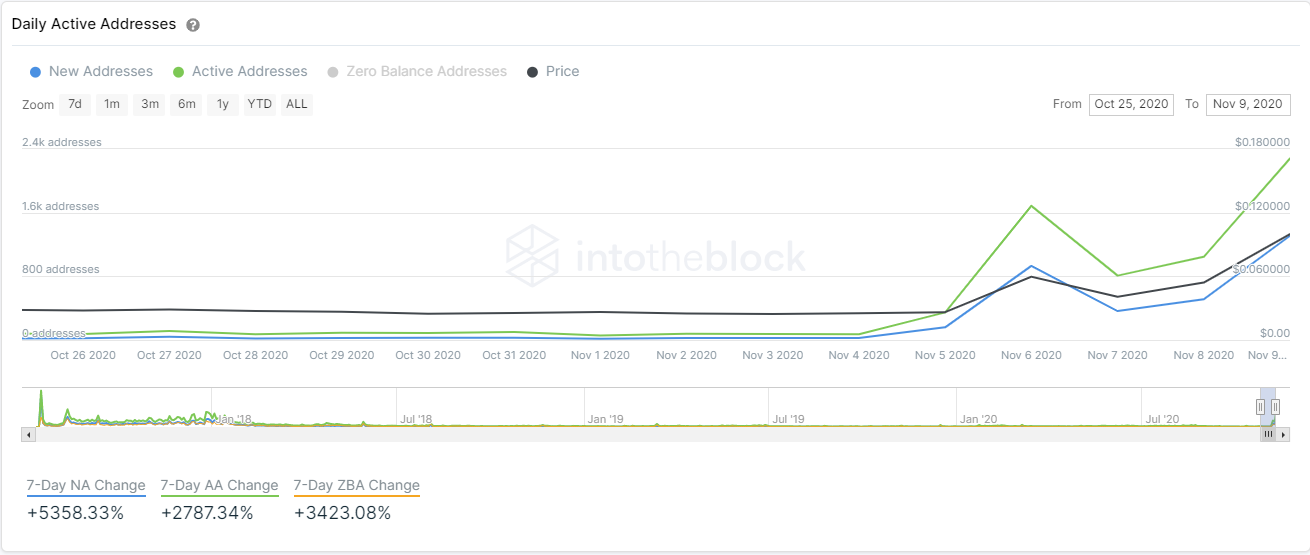
Nonetheless, the chart of new addresses joining the network shows a colossal spike of +5,357% in the past week, which clearly means that a lot of new users got interested in the digital asset.

Similarly, the number of active addresses exploded by 2,783% and continues to be in an uptrend. The renewed interest in Civic is a bullish factor in the short and long terms.
However, this is by no means the all-time high Civic price. On January 3, 2018, the digital asset peaked at $1.38 per coin with a total market capitalization of $472 million. Civic is still down by more than 90% from its all-time high.
Do you think Civic can conquer $1.38 again thanks to the revitalized interest in the digital asset?
Make sure to join our Trading Group on Telegram for more trading tips!


