
Bitcoin Price Reclaims $64,000 as Wall Street Calls It an Accumulation Phase
Bitcoin pushed back above $64,000 while VanEck, BlackRock and Winklevoss all pointed to accumulation. Here is what $10,000 is worth if BTC hits $100,000.





Which topics should we dive deeper into?
Select what genuinely interests you. Your picks feed directly into our editorial planning.
Crypto news that's actually worth your time.
Weekly. 60 seconds. Carefully curated by our editors: no hype, no promo flood, no spam.
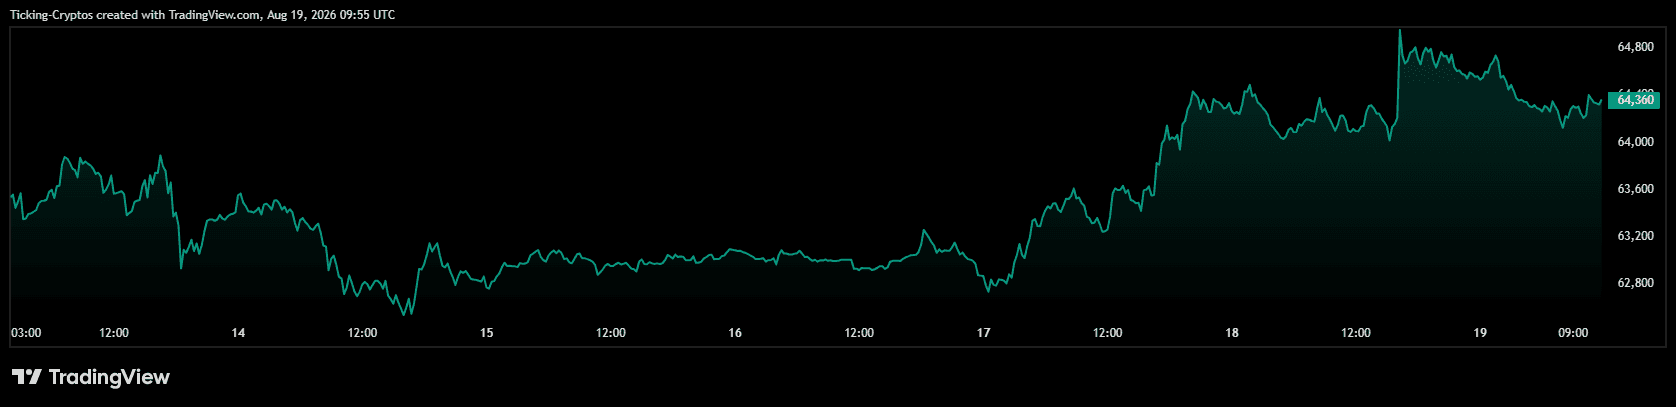
Bitcoin spent most of the summer trapped in a narrow band, and for weeks the market treated every push toward $65,000 as another chance to sell. This week the tone shifted. BTC crossed back above $64,000 and briefly tagged $65,000 intraday for the first time in over a week, and it did so on a session where US equity ETFs were red. That relative strength is small on its own. What makes it interesting is the pile of institutional commentary that landed on exactly the same day.
How did Bitcoin push back above $64,000?
$Bitcoin reclaimed $64,000 because buyers defended the $62,277 range floor and momentum flipped just as regulatory and institutional headlines turned supportive.
On the daily chart, BTC is trading around $64,331 after opening at $64,686 and dipping to $64,113. The move is modest in isolation, roughly half a percent lower on the day, but it comes after price held the lower edge of a range that has contained Bitcoin since June.
The context matters more than the candle. Bitcoin pushed above $64,000 on Monday even as the S&P 500 slipped, ahead of the Federal Reserve minutes. The next session took price across $65,000 in intraday trading for the first time in more than a week, up 1.7% in 24 hours before easing back toward $64,700, while the SPY, DIA and QQQ ETFs all traded lower. Bitcoin outperforming equities on a risk-off day is the kind of divergence that tends to show up when sellers are exhausted rather than when buyers are aggressive.
The macro backdrop is still not friendly. The 30-year US Treasury yield climbed to 5.31%, its highest level since June 2007, and Japan's 30-year yield hit a record 4.05%. Bitcoin holding a range while long-end yields spike is notable in itself.
What does the BTC chart actually show right now?
The daily chart shows a compressed range between $62,277 and $66,803, with the 200-day EMA at $71,448 still capping any medium-term trend reversal.
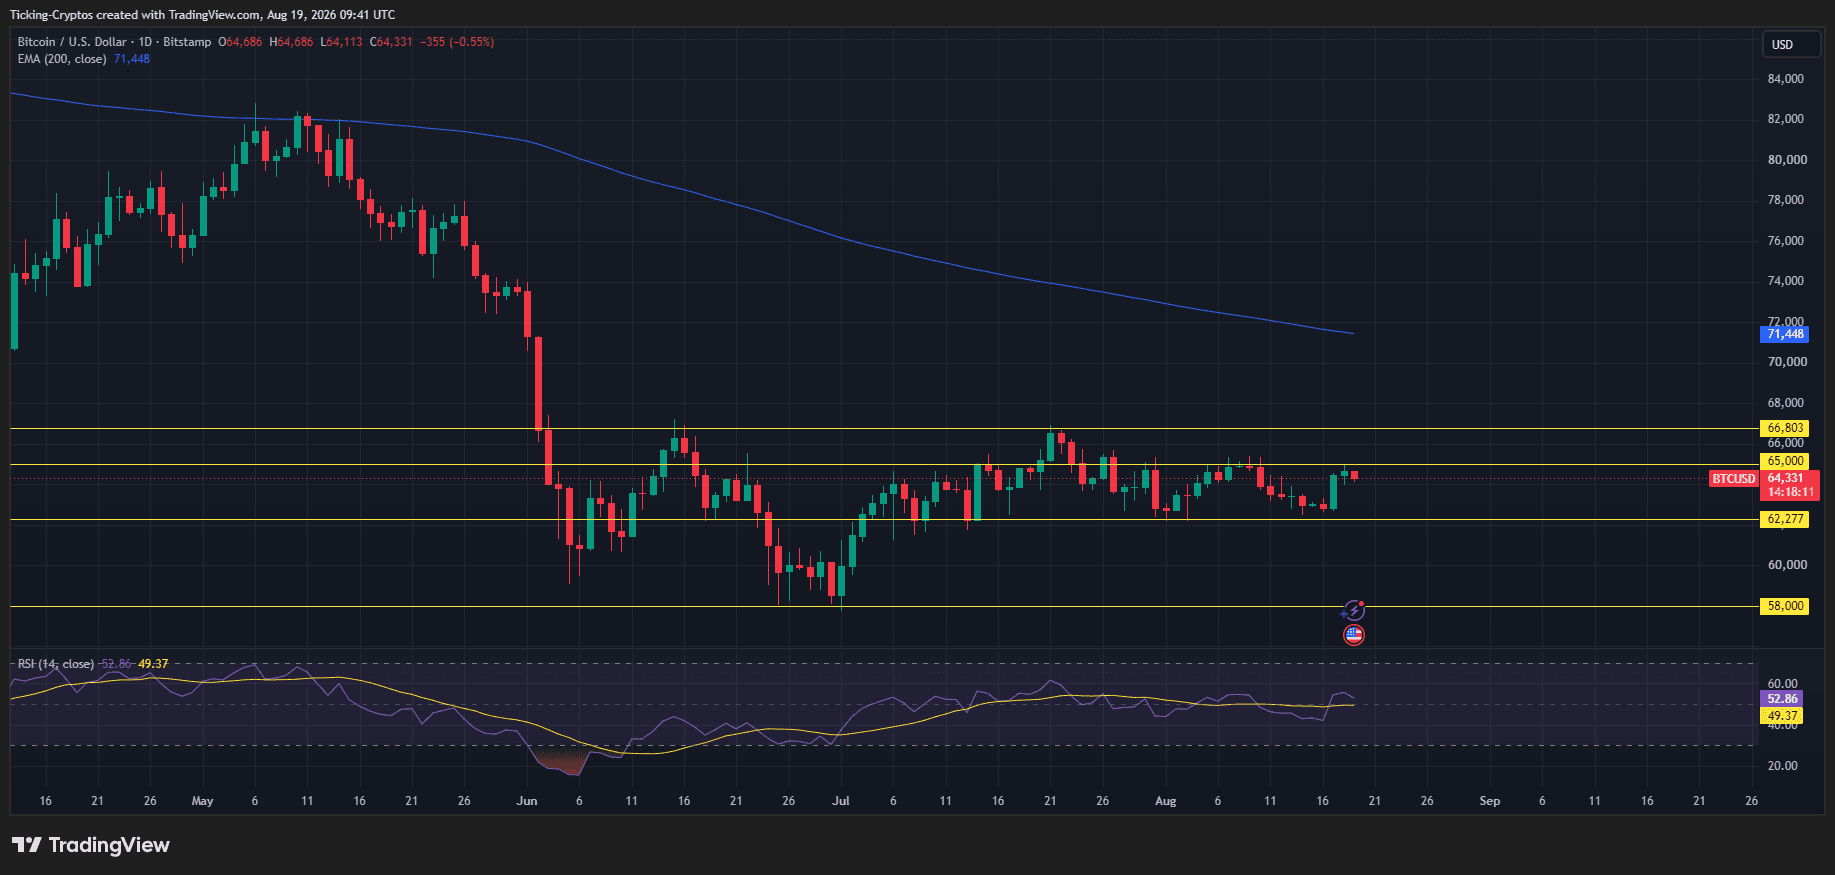
Here is the structure traders are watching:
- $66,803 is the top of the range and the level that has rejected every rally since June
- $65,000 is the immediate psychological pivot, tested this week and not yet reclaimed on a daily close
- $62,277 is the range floor and the line that has absorbed each flush
- $58,000 is the deeper support shelf from the early June capitulation candle
- $71,448 is the 200-day EMA, roughly 11% above spot and sloping down
RSI on the daily sits at 52.86 and has just crossed back above its own moving average at 49.37. That is not a momentum breakout, it is a neutral reading turning marginally constructive. For a market that spent June and July with RSI pinned below 50, the cross matters as a change in character rather than a signal on its own.
The practical read is simple. Until BTC closes a daily candle above $66,803, this is still a range. A close above that level opens the gap toward the 200-day EMA at $71,448. A daily close below $62,277 puts the $58,000 shelf directly in play.
Why is everyone calling this an accumulation phase?
Analysts are calling this an accumulation phase because capitulation indicators have fired, long-term holders have finished selling, and large wallets have flipped from distribution back to buying.
The most detailed version of this argument came from VanEck this week. The asset manager's researchers, Senior Investment Analyst Patrick Bush and Head of Digital Assets Research Matthew Sigel, found that eight of the twelve signals in their Bitcoin Capitulation Check are currently flashing, and that all twelve dropped into the capitulation zone at some point over the past three months. Their conclusion was that the market has witnessed what appears to be bitcoin price capitulation and is nearing or currently in an accumulation phase.

The timing argument rests on cycle history. VanEck notes the three previous bear phases averaged 12.7 months from peak to maximum drawdown, and Bitcoin is now roughly in its 11th month from the early October 2025 top, which places a potential transition to accumulation somewhere between September and November.
 FOMO FamilySponsored
From the chart to the trade, on your phone
We used FOMO Family ourselves and bought tokens with it. Deposit, find the token, buy: it takes seconds, with no wallet setup. Our link gets you ten percent off the fees.
Get the app and 10% off fees →Crypto is high risk, a total loss is possible. Partner link.
The supply side supports the same reading. Long-term holders sold 356,000 BTC over the past month, dropping their share of supply below 60%, while US spot Bitcoin ETFs recorded their largest daily inflow since early May. Long-term holders distributing into a falling market is what the late stage of a drawdown looks like. When that cohort finishes and the coins have found new owners at lower prices, the float above the market gets thinner.
VanEck was careful not to oversell it. The firm warned against treating the capitulation signals as reliable short-term buy triggers, noting that similar periods with eight to twelve indicators firing produced average 90-day and 180-day returns below baseline. It also said it expects a shallower trough this cycle, pointing to spot Bitcoin ETPs, a larger institutional holder base and the absence of the lender and exchange failures that amplified previous downturns.
Are Bitcoin whales really buying again?
Yes, large holders have added roughly $2.9 billion of Bitcoin over the past 60 days after months of net selling, according to Bloomberg citing CryptoQuant data.
Large holders added about 43,000 BTC over the past 60 days, worth roughly $2.75 billion at current prices according to CryptoQuant, whose calculation excludes exchanges and mining pools. The cohort recommitted, after months of selling, when the coin started trading around $60,000, with balances from smaller "dolphin" wallets also growing. Watcher.Guru and other outlets have reported the headline figure at more than $2.9 billion, with the gap explained by the price level used to value the coins.
The split between cohorts is the interesting part. Wallets holding more than 10,000 BTC accumulated 46,420 BTC in the same 60-day window, the strongest whale buying since March 2026, while smaller retail holders sold nearly 10,000 BTC over the same period. That divergence, big money buying while small accounts sell into fear, is a pattern that historically shows up near cycle lows rather than near tops.
There is a caveat worth stating plainly. Bloomberg's report also flagged concerns about the loss of retail participation, with August spot volumes the lowest for that month since August 2021. Accumulation on thin volume is still accumulation, but it is not the same as broad demand returning.
There is also skepticism about interpretation. On Bloomberg Crypto, Delta Blockchain Fund's Kavita Gupta argued that some of what shows up as whale accumulation looks more like movement of Bitcoin between wallets than genuine net buying. On-chain cohort data always carries that ambiguity.
What did the SEC just propose for crypto?
The SEC proposed "Regulation Crypto Assets" on 18 August, a framework creating two registration exemptions and a conditional safe harbour for crypto asset offerings.
The Commission announced that it proposed new rules that would create a clear and fit-for-purpose framework for certain investment contracts involving crypto assets, following its March 2026 interpretation clarifying how federal securities laws apply to crypto assets and transactions.
The mechanics:
- A "startup exemption" allowing crypto offerings to raise up to $5 million over a four-year period without registration, subject to principles-based disclosure
- A "fundraising exemption" permitting larger offerings of up to $75 million in any 12-month period
- A safe harbour under which a digital asset would no longer be treated as a security once certain conditions are met and the issuer has ceased all managerial efforts
- Pre-emption of state securities registration requirements for qualifying offerings and some secondary transactions
Reuters described it as the first major step under the current administration to give the industry the tailored rules it has long pushed for. SEC Chair Paul Atkins framed it as part of a strategy to onshore innovation in crypto asset markets. The move came after Congress stalled on the CLARITY Act, and was unexpected given the agency had cancelled a 14 August meeting meant to propose the same rule.
This is not law yet. A 60-day public comment period begins once the proposal is published in the Federal Register, and the SEC has assigned it file number S7-2026-27. For Bitcoin specifically, the direct impact is limited, since BTC was never the asset at the centre of the securities question. The indirect impact is what matters: a clearer rulebook lowers the regulatory discount applied to the whole asset class.
Does BlackRock still back Bitcoin after a 50% drawdown?
BlackRock says the drawdown is a positioning correction rather than a change in the investment case, and continues to back a 1% to 2% portfolio allocation.
BlackRock's research points to crypto-specific leverage, slowing institutional inflows and selling from large holders as the main drivers of Bitcoin's decline. Speculative positioning reached extreme levels in October 2025, with Bitcoin futures open interest above $90 billion, and the 10 October liquidation cascade wiped around $20 billion from open interest in a single day, with further liquidation waves in February and June.

That framing has a specific consequence for how you read the correlation data. BlackRock argues these leverage episodes explain Bitcoin's temporarily elevated correlation with equities, since forced liquidations make BTC behave like a conventional risk asset, while at other times it has displayed its other personality as a macro hedge.
On sizing, the firm's position is unchanged. A trailing 10-year analysis found that allocating 1% to 2% of a traditional 60/40 portfolio to Bitcoin, funded from equities, would have improved risk-adjusted returns while broadly maintaining comparable portfolio risk characteristics.
Cameron Winklevoss put the same idea in far less institutional language. The Gemini co-founder argued that the AI trade has handed the world a time machine to go back and invest in Bitcoin at $65,000, noting that a year ago, if Bitcoin had been offered at a 50% discount to its then-current $120,000, there would have been unlimited buyers. He called it an unprecedented time to buy the dip, hiding in plain sight.
Not everyone agrees on the level. Anthony Scaramucci held a $100,000 long-term target while describing Bitcoin as being in a clear bear market, saying the next major catalyst is the 2028 halving, roughly 20 months out. One BeInCrypto cycle-timing study placed the bear market bottom nearer $47,000.
Does an accumulation phase always lead to a bull run?
No. Accumulation phases have historically preceded Bitcoin's largest expansions, but they can extend for months and are defined only in hindsight.
The logic behind the bullish reading is mechanical rather than mystical. In an accumulation phase, coins move from holders who are price-sensitive and leveraged into hands that are neither. Exchange float shrinks. The supply that would otherwise be dumped into any rally has already been sold. When demand eventually returns, whether from ETF flows, a liquidity shift, or a macro catalyst, it meets a thinner order book and price moves faster than fundamentals alone would suggest.
That is the structural case, and it is genuinely what happened in 2015, 2019 and 2020. But the honest version has three caveats:
- Timing is not the same as direction. VanEck's own data shows that entering when eight to twelve capitulation indicators are firing produced below-baseline 90-day and 180-day returns. The cohort only outperformed at the one-year mark, and on a small number of distinct episodes.
- Accumulation can extend. VanEck's own range for a transition runs from September through November 2026. Ranges can grind for a long time before they resolve.
- This cycle has a competing asset. Capital rotating into AI has been a persistent drag on crypto flows all year. That rotation could reverse in Bitcoin's favour, or a broad risk-off event could take both lower first.
An accumulation phase raises the probability of an eventual expansion. It does not schedule one.
What would $10,000 be worth if Bitcoin reaches $100,000?
At $64,331, a $10,000 investment buys roughly 0.1554 BTC. If Bitcoin reaches $100,000, that position would be worth about $15,545, a gain of roughly $5,545 or 55.4%.
Here is the full range of outcomes on a $10,000 position entered at current spot:
| BTC price | Position value | Return |
|---|---|---|
| $47,000 (bear case) | $7,306 | -26.9% |
| $58,000 (lower support) | $9,016 | -9.8% |
| $62,277 (range floor) | $9,681 | -3.2% |
| $66,803 (range top) | $10,384 | +3.8% |
| $71,448 (200-day EMA) | $11,106 | +11.1% |
| $80,000 | $12,436 | +24.4% |
| $100,000 | $15,545 | +55.4% |
| $126,198 (previous ATH) | $19,617 | +96.2% |
A few things stand out. First, $100,000 is not a moonshot from here, it is a 55% move, which Bitcoin has delivered inside a single quarter multiple times. Second, a full round trip to the October 2025 all-time high of $126,198 still does not quite double the position, which is a useful reminder of how much of the previous cycle's gain has already been given back. Third, the downside to the $47,000 bear case costs more in percentage terms than the move to the range top gains.
The BlackRock sizing framework is worth applying to that table. A 1% to 2% allocation on a $500,000 portfolio is $5,000 to $10,000. At that weighting, the $47,000 scenario costs roughly 0.5% of the total portfolio, while the $100,000 scenario adds about 1.1%. That asymmetry is the entire argument for small, disciplined position sizing in a volatile asset, and it is why the institutional recommendation has stayed at 1% to 2% through both the run to $126,000 and the fall back to $64,000.
Dollar-cost averaging changes the arithmetic further. If the accumulation phase does extend into November as VanEck's range suggests, a lump sum entered today is exposed to months of chop, while a staged entry across that window lowers the average cost basis if price revisits the $58,000 to $62,000 zone.
Bitcoin Price Prediction: What should investors watch next?
The decisive signals are a daily close above $66,803, a sustained turn positive in CryptoQuant's spot demand metric, and the direction of ETF flows.
The on-chain trigger is specific. CryptoQuant's 30-day apparent spot demand indicator has recovered from -206,000 BTC on 23 July to roughly -5,000 BTC, putting it at the point of turning positive for the first time since 26 February 2026. That crossover, if it holds, would be the first hard confirmation that the demand contraction which has weighed on price since last year has actually ended.
On the chart, the checklist is short. Reclaim and hold $65,000. Close above $66,803 to break the range. Then the 200-day EMA at $71,448 becomes the real test, since that is the level that separates a relief rally from a trend change.
Frequently asked questions about the Bitcoin accumulation phase
More on Bitcoin: All Bitcoin news at a glance
Related articles
- Bitcoin Price Prediction: How Will September Unfold For BTC Price?
- Bitcoin Price Prediction: How Will BTC Price Move Following Gold's Surge?
- Bitcoin Surges Past $60K: The Start of a Major Rally or Just Another Bull Trap?
- Bitcoin News Today: Why Is Bitcoin Price Up Starting July?
- How Important Is The $70k Level For BTC Price Bullish Momentum?
Which topics should we dive deeper into?
Select what genuinely interests you. Your picks feed directly into our editorial planning.
Crypto news that's actually worth your time.
Weekly. 60 seconds. Carefully curated by our editors: no hype, no promo flood, no spam.

July 8, 2024 7:51 AM

Crypto Market Crash News As BTC Price Crash Back To 56K
With the crypto market crash, and Bitcoin price drop to below 56k with recent dormant BTC whales activity, what comes next: a correction or further crash soon?
February 12, 2026 4:35 PM

Bitcoin Price Crashes Below $66,000 as Liquidations Pass $50M
Bitcoin falls below $66,000 following a massive liquidation cascade and a bearish report from Standard Chartered. Regulatory hurdles further dampen the mood.
May 14, 2024 11:59 AM

Bitcoin Whales and Market Trends: What’s Driving the Accumulation?
Bitcoin Whales are influencing market trends with strategic accumulation moves. What will this mean for Bitcoin's future price?
November 4, 2025 9:51 PM

BREAKING: Bitcoin Crashes Below $100K, Panic Grips the Crypto Market
Bitcoin just plunged below $100K for the first time in months, dragging the entire crypto market into a sea of red. Is this the start of the long-awaited correction?
November 11, 2024 11:10 AM

Bitcoin Price Breaks Above $82k: Watch Out For These Key Levels
Bitcoin reaches a new all-time high, surpassing $82k, following Trump’s win and anticipating new pro-crypto policies. What are the next important levels to watch?
April 19, 2025 4:00 AM

US China Tariff War Over: Will BTC Price Hit $100K?
Will BTC price go back to over the $100K mark as the US China tariff war seems to have reached a negotiation point, and might end soon?
November 10, 2025 4:00 AM

Bitcoin Bounces Back as Trump’s $2,000 Dividend Plan and Michael Saylor’s Hint Spark Market Optimism
Bitcoin rebounds above $103K after Trump’s $2,000 dividend plan and Michael Saylor’s hint at buying more BTC reignite bullish momentum.
August 7, 2024 10:29 AM

Bitcoin Price Prediction: Will BTC Price SURGE Past Or DROP Below $57k?
As Bitcoin is hovering around the $57k mark, traders can't help but wonder if it will surge past it or drop back below it. Here is all you need to know...
March 13, 2026 10:50 AM

Bitcoin Price Hits $72,500 as Joint SEC-CFTC Regulatory Framework Sparks Bullish Momentum
Bitcoin surges to $72,500 as the SEC and CFTC announce a joint regulatory framework, while BlackRock’s new ETHB ETF records a strong $15.5M debut.
November 27, 2024 4:01 PM

XRP Price Prediction amid MAJOR XRP News Today - What to Expect?
XRP news today is affecting its price, and listing it among the top trending cryptos. Here is the latest XRP price prediction. and what to expect ahead.
April 22, 2026 9:11 AM

Bitcoin Price Hits $78,000 as Ceasefire Extension Ignites Bullish Momentum
Bitcoin breaches $78,000 following the US-Iran ceasefire extension and a $2.5 billion MSTR purchase. Here is the weekly BTC chart for key 2026 price targets.
May 7, 2025 5:00 AM

Elon Musk, Larry Fink, and Mark Zuckerberg to Attend Saudi Forum: Last Chance for Crypto Investors?
MAGA in the Desert, the informal label for the Saudi-U.S. Investment Forum, sees top U.S. CEOs like Elon Musk, Larry Fink, and Mark Zuckerberg heading to Riyadh. This is igniting crypto investor interest as $600B in deals are on the table.
December 12, 2024 11:28 AM
Bitcoin Hits $100K Again – But a Crash to $60K Might Be Next
Bitcoin is back at $100K after dropping to $94K, but concerns are growing as BTC faces strong resistance at $104K. Will the bullrun continue, or is a major crash coming in January?
October 21, 2025 4:17 PM

Bitcoin Surges Past $112,000 as the Fed Opens Doors to Crypto: What’s Next?
Bitcoin jumps above $112,000 after the U.S. Federal Reserve hinted at granting crypto firms access to its payment network. Here’s what this means for BTC and the broader market.
April 30, 2026 11:29 AM

Bitcoin ETF Inflows Hit $2.44B in April: Is the Bull Market Back?
Bitcoin spot ETFs recorded $2.44 billion in net inflows this April, signaling a massive return of institutional interest and a potential market shift for 2026.
March 4, 2025 9:17 PM

Bitcoin Price Prediction ahead of the Upcoming White House Crypto Summit
With the remarkable Bitcoin volatility, and after briefly surging earlier this week before dropping again. Is a Bitcoin price surge expected ahead of or after the upcoming White House Crypto Summit?
June 24, 2024 10:37 AM

Bitcoin Price Prediction: Can BTC Price Fall Below 50K?
The profitability of Bitcoin futures cash-and-carry trades has plummeted amid a significant crypto market selloff. What are the reasons behind the decline and what can traders expect next?
May 16, 2025 12:36 PM

Bitcoin Price Prediction 2025: $200K SOON?
Bitcoin continues to dominate headlines, with institutional giants and world leaders embracing its potential. Can Bitcoin price hit $200K soon in 2025?
December 10, 2024 12:30 AM

Bitcoin Price Drops Below $100K – Is a Bigger Crash Coming?
Bitcoin has fallen below $100K, triggering a broader market correction of over 8% in the last 24 hours. With profit-taking and large sell-offs hitting the market, could Bitcoin drop to $90K or lower?
July 27, 2024 2:34 PM

Why Is The Crypto Market Up TODAY?
With the Bitcoin 2024 Conference taking place now in Nashville, the crypto market is showing bullish signals, intriguing traders around the future of Bitcoin and Altcoins.
April 26, 2025 10:30 AM

Bitcoin Price Prediction: BlackRock Buys $240M More BTC as $100K Target Nears
In major Bitcoin news, BlackRock has bought an additional $240 million worth of BTC, boosting market confidence. The $100K milestone now seems closer than ever.
February 15, 2025 11:34 AM

Bitcoin Price Surges Amid International Governmental Adoption - Can It Break $100K?
Bitcoin price is on the rise, fueled by massive international adoption and growing interest in crypto custody services. Will these developments push Bitcoin past the elusive $100K mark?
April 18, 2025 1:05 PM

Massive BTC & ETH Options Expiry Today – What It Means for the Market
Over $2.25 billion in Bitcoin and Ethereum options are expiring today, sending ripples across the crypto market. With traders eyeing the “max pain” levels, could we see sudden price swings in BTC and ETH?
November 3, 2025 8:01 PM

Bitcoin Price Below 100K: Is This the Start of a Deeper Crash?
Bitcoin drops to 107K after losing key support. Analysts warn that breaching 107K could trigger a slide toward 100K or even lower.
March 10, 2026 8:47 AM

Bitcoin Reclaims $70,000: Why is BTC Price Surging Despite Middle East Tensions?
Bitcoin price has surged back above the $70,000 mark. Explore the technical chart analysis and how Middle East instability is shaping the current BTC rally.

More from CryptoTicker