Bitcoin Price Prediction: BTC Cracks $13,700 And Further Widens The Gap With Stock Market
We already talked about Bitcoin decoupling from the stock market in our last article. It seems that this correlation is getting broken even further today as the stock market plunged while Bitcoin continues climbing higher hitting a high of $13,750 […]


We already talked about Bitcoin decoupling from the stock market in our last article. It seems that this correlation is getting broken even further today as the stock market plunged while Bitcoin continues climbing higher hitting a high of $13,750 on several exchanges.
BTC/STOCKS Comparison – TradingView
Despite the upcoming U.S. presidential elections, it seems that crypto investors are not worried whatsoever. Many analysts expected a correction at around $13,000; however, it seems that the digital asset faces almost no resistance to the upside.
Bitcoin Price Analysis: Where is Bitcoin Headed Next?
The price of Bitcoin painted a clear bull flag on the daily chart which has been confirmed today after a significant 5% breakout towards $14,000. The 2019-high is established at $13,970 which is the next price target for the bulls that are facing very little opposition to the upside.
BTC/USD daily chart – TradingView
The MACD remains bullish and gaining momentum while the RSI continues climbing higher even though it’s already overextended. Despite this overextension, most technicals are indicating investors to buy.
Out of 17 moving averages, 16 show a ‘strong buy’ signal. Oscillators remain neutral. A similar story is painted on the lower time frames including the 4-hour chart and even the 1-hour chart. Even more notable is the weekly chart which shows 17 out of 26 indicators as positive with 7 neutral and only 2 ‘sell’ indicators.
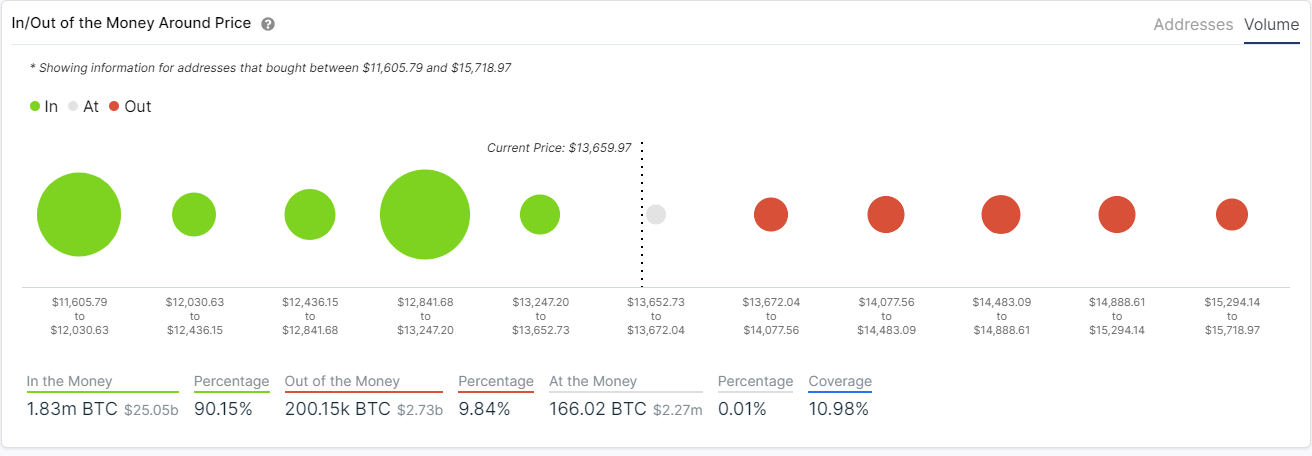
The IOMAP chart shows no significant resistance ahead, not even at $14,000. Support below is clearly stronger in comparison with the most notable area between $12,841 and $13,247. It seems that Bitcoin is free to run towards at least $15,718 without much opposition above.
The MVRV chart is a bit extended and represents increased selling pressure, however, this number has been far higher in the past. It’s also worth noting that the current bullish momentum might be simply too strong.
The current exchange inflow of BTC is fairly low, which means not a lot of investors are sending their Bitcoin towards exchanges. This usually is a good indicator for the bulls as it means people are not willing to sell, despite the price of the digital asset going up.
Although $14,000 is the next price target, it seems that Bitcoin can easily reach its all-time high at $20,000 again looking at the various indicators and on-chain metrics. Do you think the ranked 1 digital asset has what it takes to reach and potentially crack the $20,000 level?