Bitcoin Price Above $9,400, Bulls Looking at $10,000
So far, this week has been extremely positive for Bitcoin as the bulls were able to break above the high of $9,198. Bitcoin price is now at around $9,314 after two consecutive days of gains, both posting 5% gains. Bitcoin […]


So far, this week has been extremely positive for Bitcoin as the bulls were able to break above the high of $9,198. Bitcoin price is now at around $9,314 after two consecutive days of gains, both posting 5% gains.
Bitcoin broke the high yesterday with increasing bull volume, a very good sign for the bulls. The daily RSI is now on the verge of an overextension but this doesn’t mean bulls can’t see further upside.
Bitcoin Price Short Term Forecast: Bullish
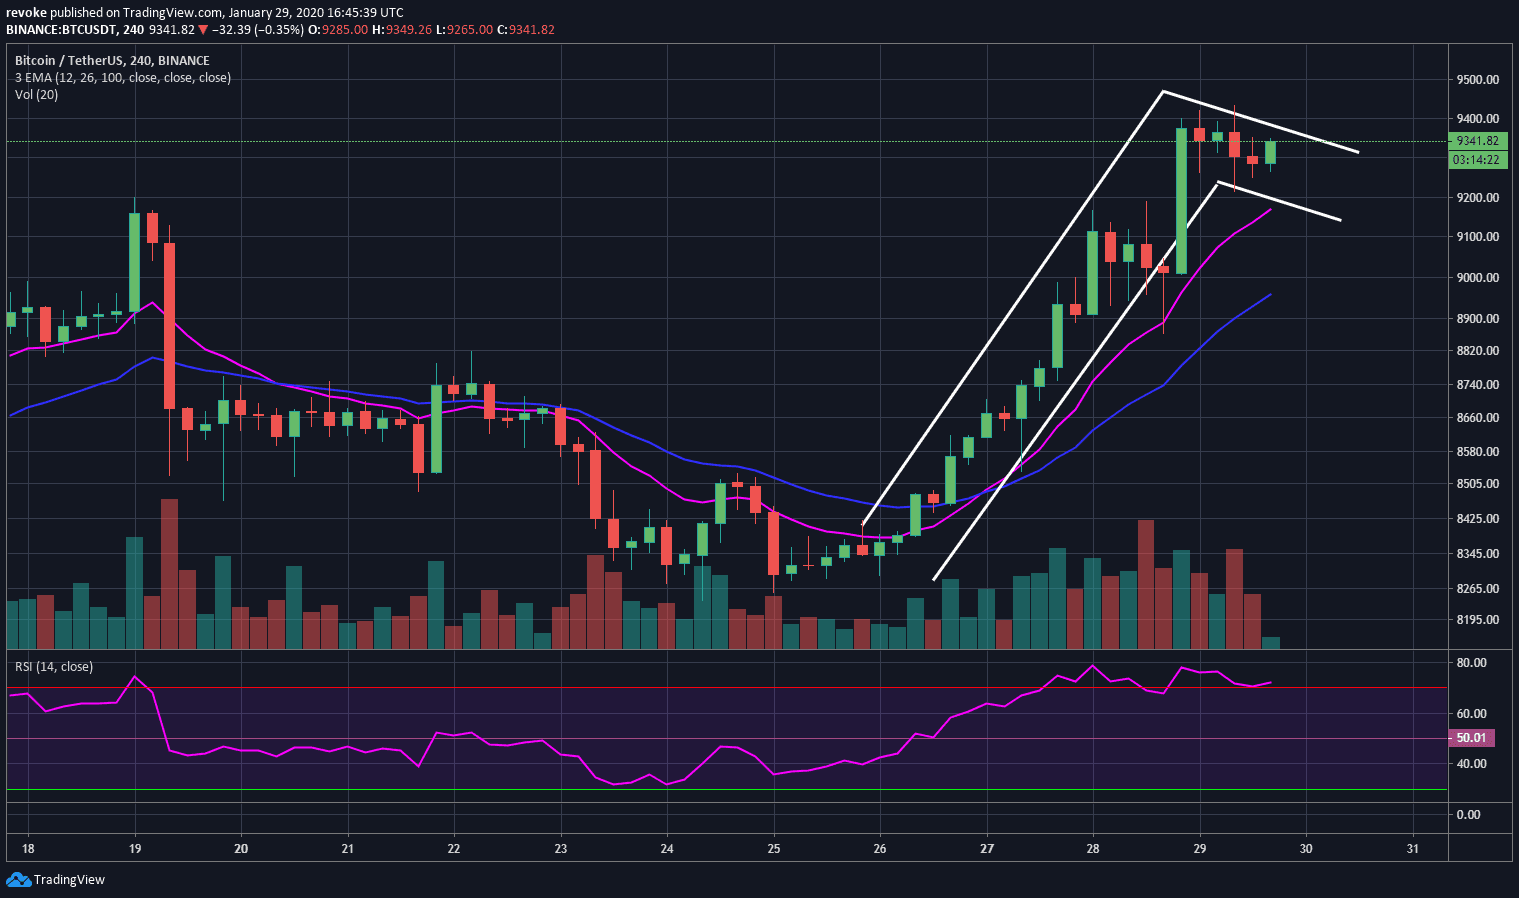
The forecast for Bitcoin price is really positive as the daily chart is in a clear and strong uptrend and the 4-hour chart has currently formed a bull flag.
The RSI (Relative Strength Index) has been overextended for more than 24 hours and Bitcoin will probably experience a steeper pullback soon.
This is not guaranteed though, as the RSI can get overextended way beyond 80 and even 90 points before cooling off. The bulls are looking at $9,216 support and especially at $8,862 on the 4-hour chart.
The hourly chart is clearly sideways and it’s not giving us much information right now. The bulls have been able to stay above the 12-period EMA though.
Bitcoin Price Long Term Forecast: Bullish
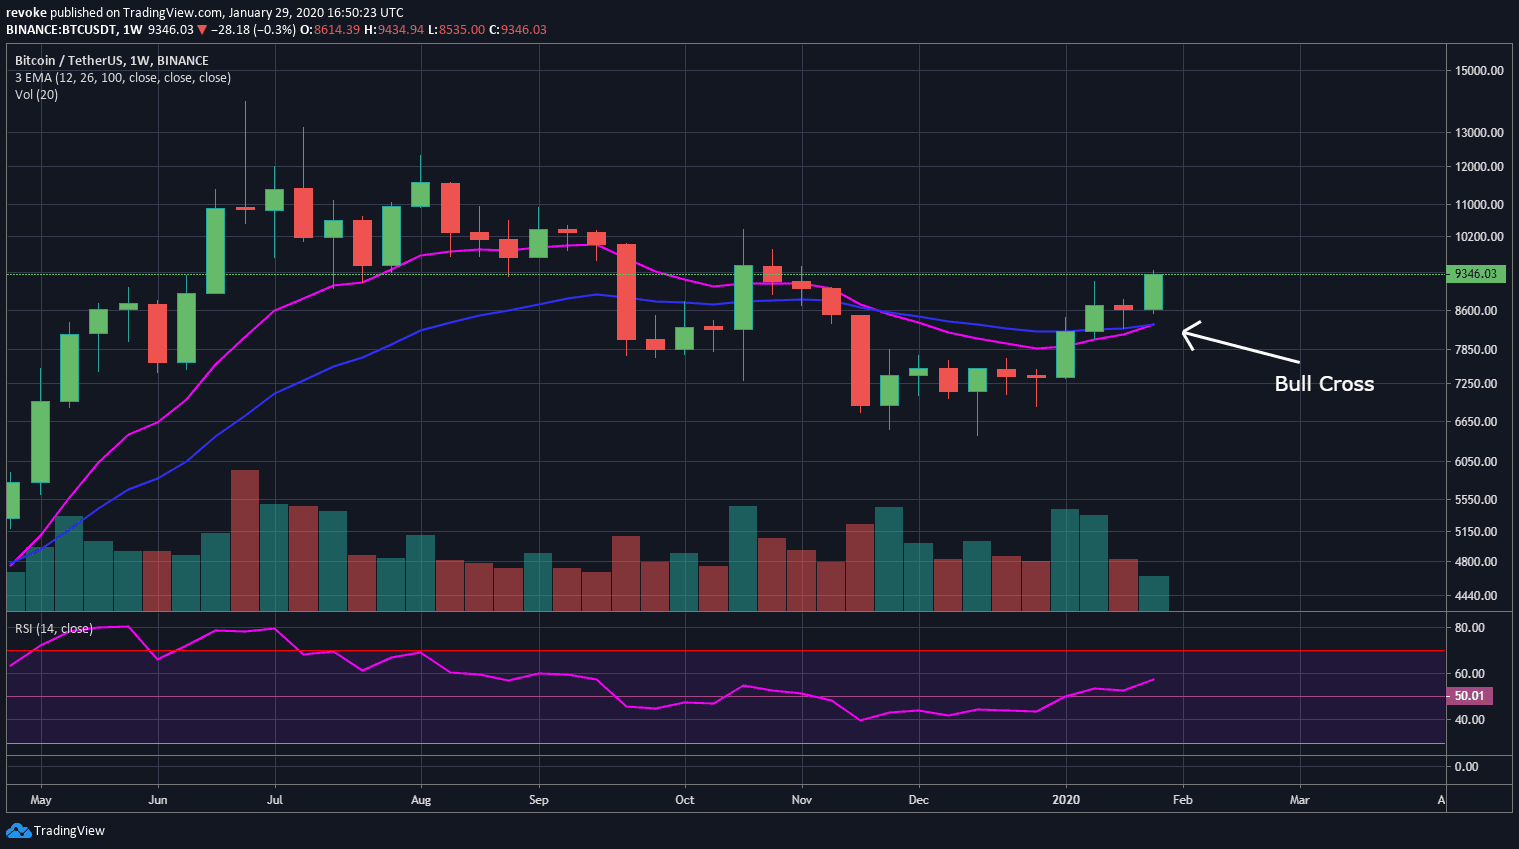
The weekly chart has not confirmed an uptrend but it’s close. The bulls need to break $10,370 or set a higher low compared to $6,435 and then break the most recent high. Either way, they have a lot of space to work with here and the 12 and 26-period EMAs are on the verge of a bull cross.
This bull cross is quite significant as we haven’t seen one since April 2019 when the bull run to $14,000 happened.
The monthly chart is waiting for that weekly trend to change and finally confirm a higher low at $6,435. Again, the bulls have a lot of space to work with here and the monthly chart is in fact in an uptrend.
What Are Other Bitcoin Technical Indicators Saying?
Most technical indicators at this point are signaling to buy, in the short and long-term. Oscillators are quite neutral on the monthly chart, however, moving averages are signaling a strong buy.
Similarly, the weekly chart indicators are showing the same signals. Bitcoin has seen a significant increase in bull volume this month as it has been higher than the previous 5 months (on Binance).
Additionally, BTC was able to break above a descending parallel channel formed on the monthly and weekly charts. Considering Bitcoin halving is really close, we could easily see $10,000 even by the end of this month.