Bitcoin Price Decoupling From The Stock Market
Bitcoin had a major breakout above $12,000 on October 20 followed by a breakout of $13,000 reaching a peak of $13,350 just 24 hours ago. The current price of Bitcoin is $12,854 after a mild pullback from the 2020-high. After […]


Bitcoin had a major breakout above $12,000 on October 20 followed by a breakout of $13,000 reaching a peak of $13,350 just 24 hours ago. The current price of Bitcoin is $12,854 after a mild pullback from the 2020-high.
After the massive bull rally, the price of BTC has established a daily bull flag which is seeking continuation to the upside within the next week. There are no bearish signs for Bitcoin in the short-term although the RSI is overextended.
This can often pose a threat to the bulls, however, considering the strong bullish momentum of the digital asset, it will most likely not have any noticeable effect.
Bitcoin Price Breaking Its Correlation With The Stock Market
After the Covid-19 pandemic hit the world, the crypto market’s correlation with the stock market became apparent. The SP&500, NASDAQ, and other indices were leading the way for Bitcoin and the majority of digital assets.
Similarly, the crypto market has been inversely correlated with the Dollar Index, meaning that when the U.S. dollar gained strength against the Euro, cryptos would go down.
BTC / Stocks Correlation – TradingView
However, recently, thanks to the breakout above $12,000 and $13,000 and the multi-million investments from large firms like Stone Ridge or Square, Bitcoin and the crypto market seem to be breaking the correlation with the stock market.
It’s worth noting that the last bearish move in the past 24 hours, seems to be correlated with the stock market again, but, the bigger picture still shows Bitcoin decoupling from stocks, at least right now.
Bitcoin Price Analysis
On the daily chart, the price of Bitcoin has established a bull flag and the IOMAP chart shows only one notable resistance area between $12,841 and $13,227. Above this point, it seems that bulls have almost no opposition until at least $14,772.
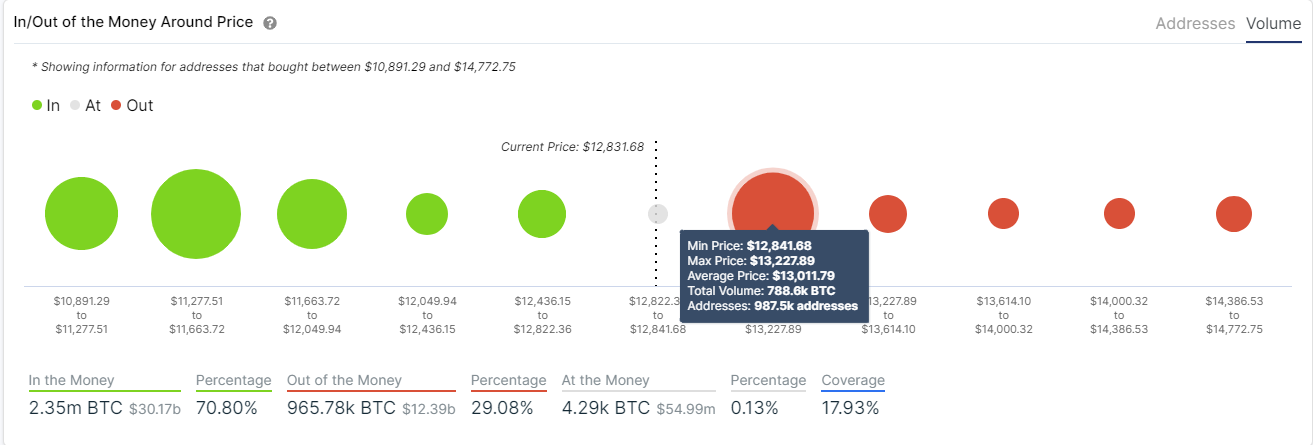
Nonetheless, the 2019 high at $13,970 which is extremely close to $14,000 will most likely act as a resistance level on the way up. So far, this is the first red week for Bitcoin since October 5. The RSI was overextended briefly on the weekly chart and it’s now cooling off.
BTC/USD Weekly Chart – TradingView
There is also a good chance that Bitcoin forms a bull flag on the weekly chart. The MACD continues gaining momentum while trading volume is declining since October 22. The 12-EMA and 26-EMA are catching up to the price and could act as strong support levels if needed.
Do you think Bitcoin has enough momentum to continue with its uptrend and ignore the price action of the stock market?