Bitcoin Price Prediction – TA predicts another 2017 like rally!
Bitcoin witnessed yet another surge in prices last week, breaking through the $14,000 and $15,000 levels and edging towards USD 16,000. With increasing positive news in the blockchain world and an indecisive legacy market, Bitcoin could easily reach the USD 20,000 price mark yet again after 2 years of a price-action rollercoaster.


Bitcoin witnessed yet another surge in prices last week, breaking through the $14,000 and $15,000 levels and edging towards USD 16,000. With increasing positive news in the blockchain world and an indecisive legacy market, Bitcoin’s price could easily reach the USD 20,000 mark yet again after 2 years of a price-action rollercoaster.
Bitcoin Price Technical Analysis
From October 2020 to date, Bitcoin’s price increased by almost 45%. This metric is considered huge in traditional financial products, hence attributed to a somehow risky trait. For blockchain enthusiasts who truly believe in the technology, this is very normal, as some financial models predict Bitcoin to reach USD 100,000 by 2021.
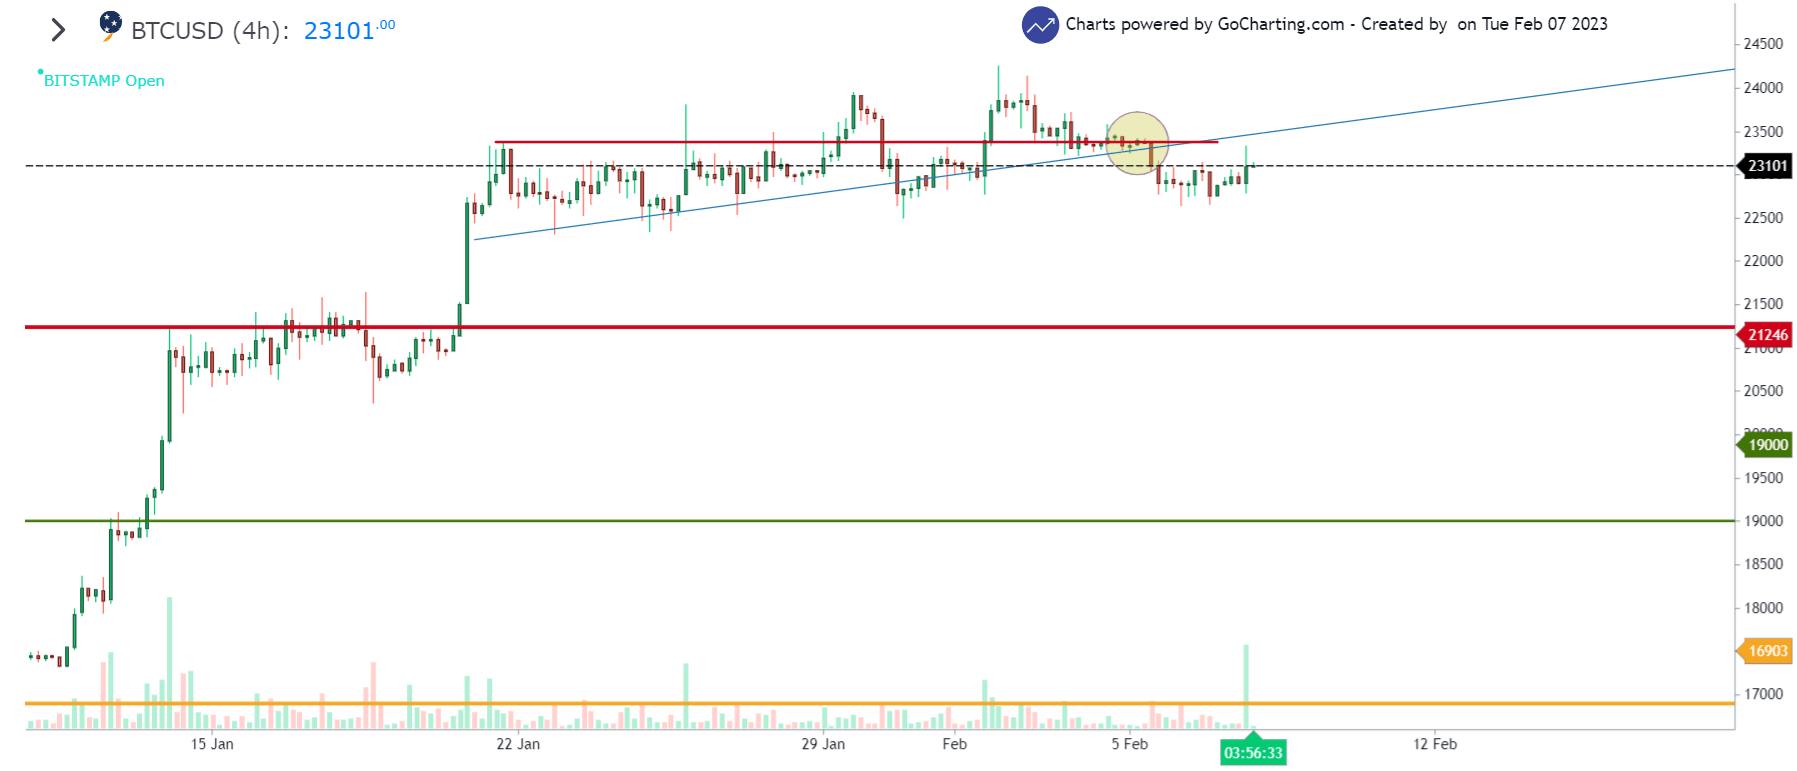
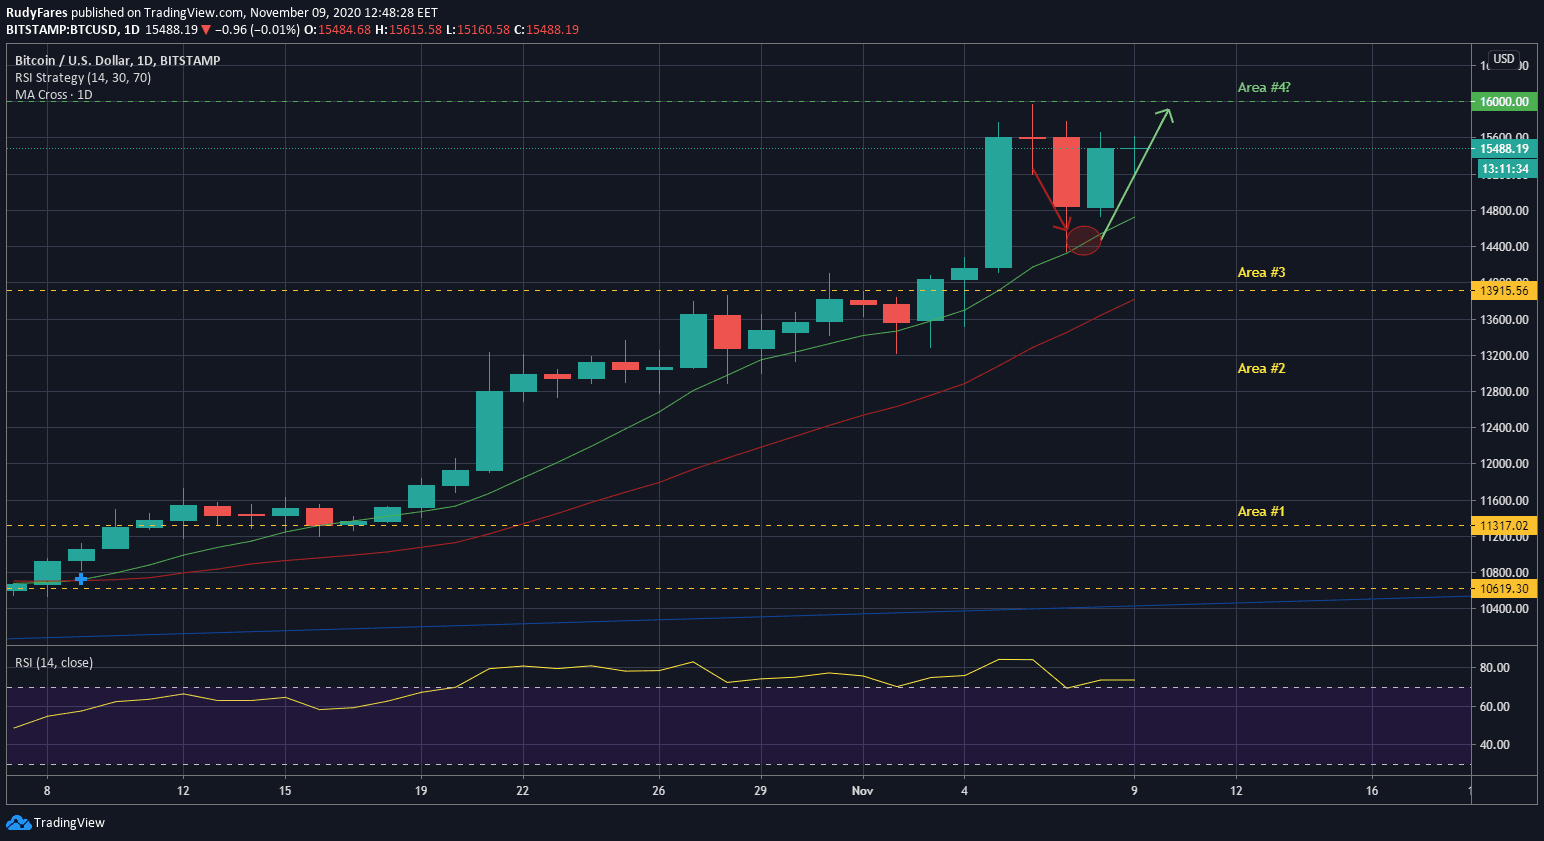
In figure 1, we can see the clear uptrend of Bitcoin since October, consolidating at a certain price level, only to breach the price and settle at a higher consolidation area (Yellow lines).
During this past weekend, prices adjusted from a 2-year high price of USD 15,950 down to USD 14,390. On Saturday, between 8 pm and 11 pm UTC+2, prices fell sharply about 6%. This move would’ve broken through all stop-loss levels of short term traders. That’s why it is very important not to have tight stop losses, as volatility spikes regularly with Bitcoin prices, especially on weekends.
Bitcoin Price Forecast – Key levels to consider
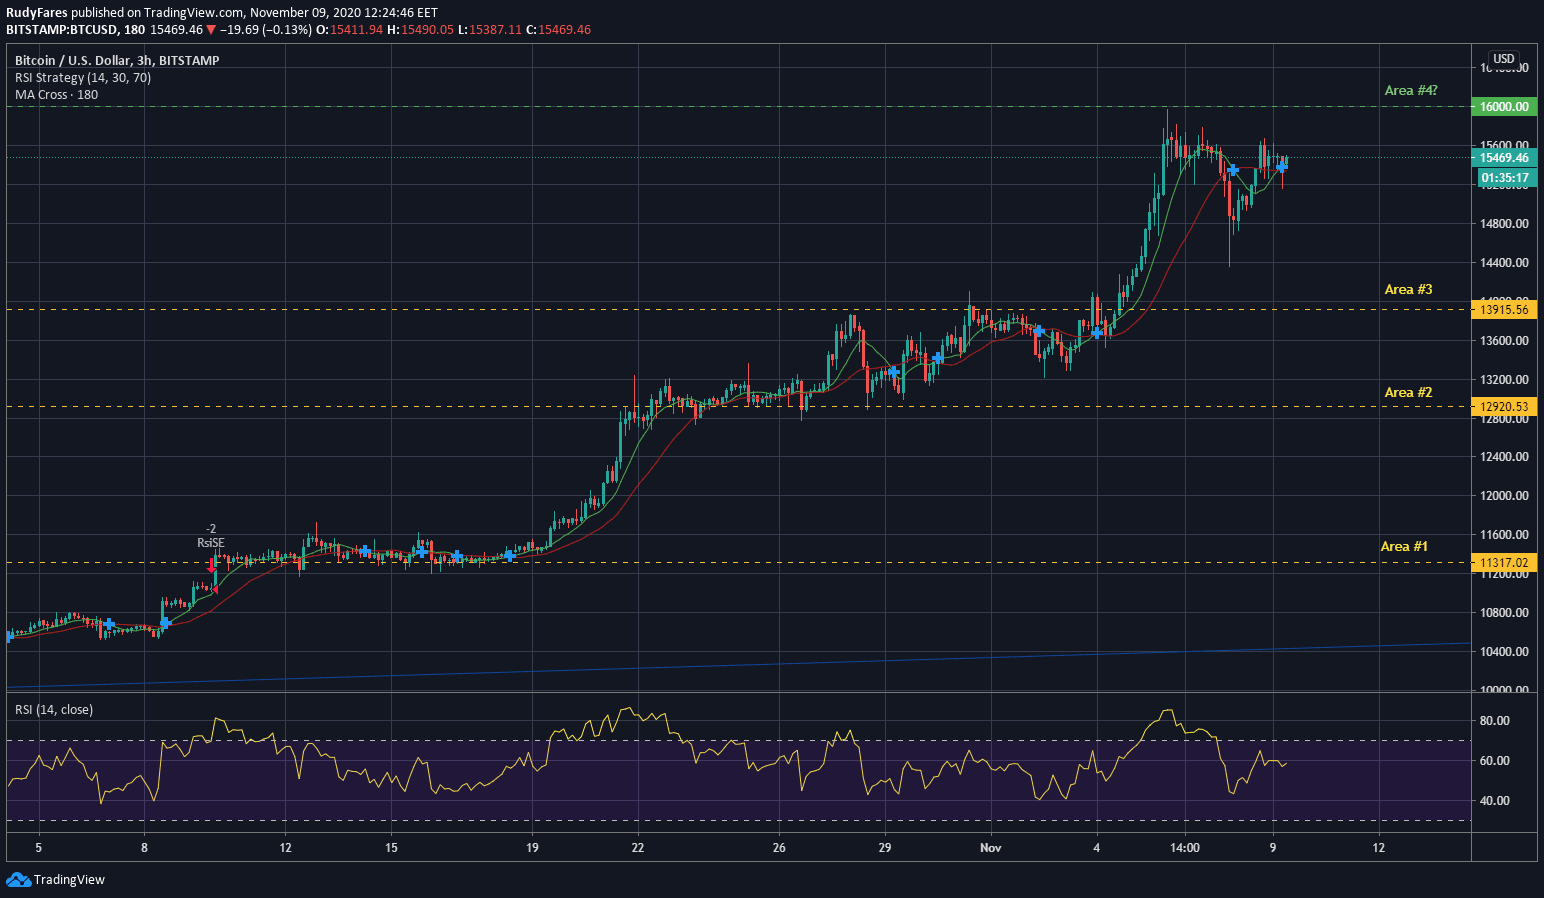
After a volatile weekend, the Bitcoin price managed to go back to its 15.5K mark. The price adjusted heavily down 6% and recovered back well above the USD 15,000 psychological price visible in figure 2.
This phenomenon is very natural whenever there’s a strong uptrend. It’s mainly because of traders closing their positions and taking their profits from the markets. In fact, if we didn’t witness such price adjustments, it would’ve been a risky situation, where traders will halt all trading activities, awaiting the price to “breath” before getting back into the market. We should always remember that good traders look for good price opportunities rather than throwing themselves in the market.
The important areas to look out for this week:
- USD 15,200 – SL#1
- USD 14,600 – SL#2
- USD 16,000 – TP#1
Is History repeating itself?
Back in 2017 when the great bull run of cryptos happened, a very similar portent happened with basically the same time of the year, same key areas, and same price-action.
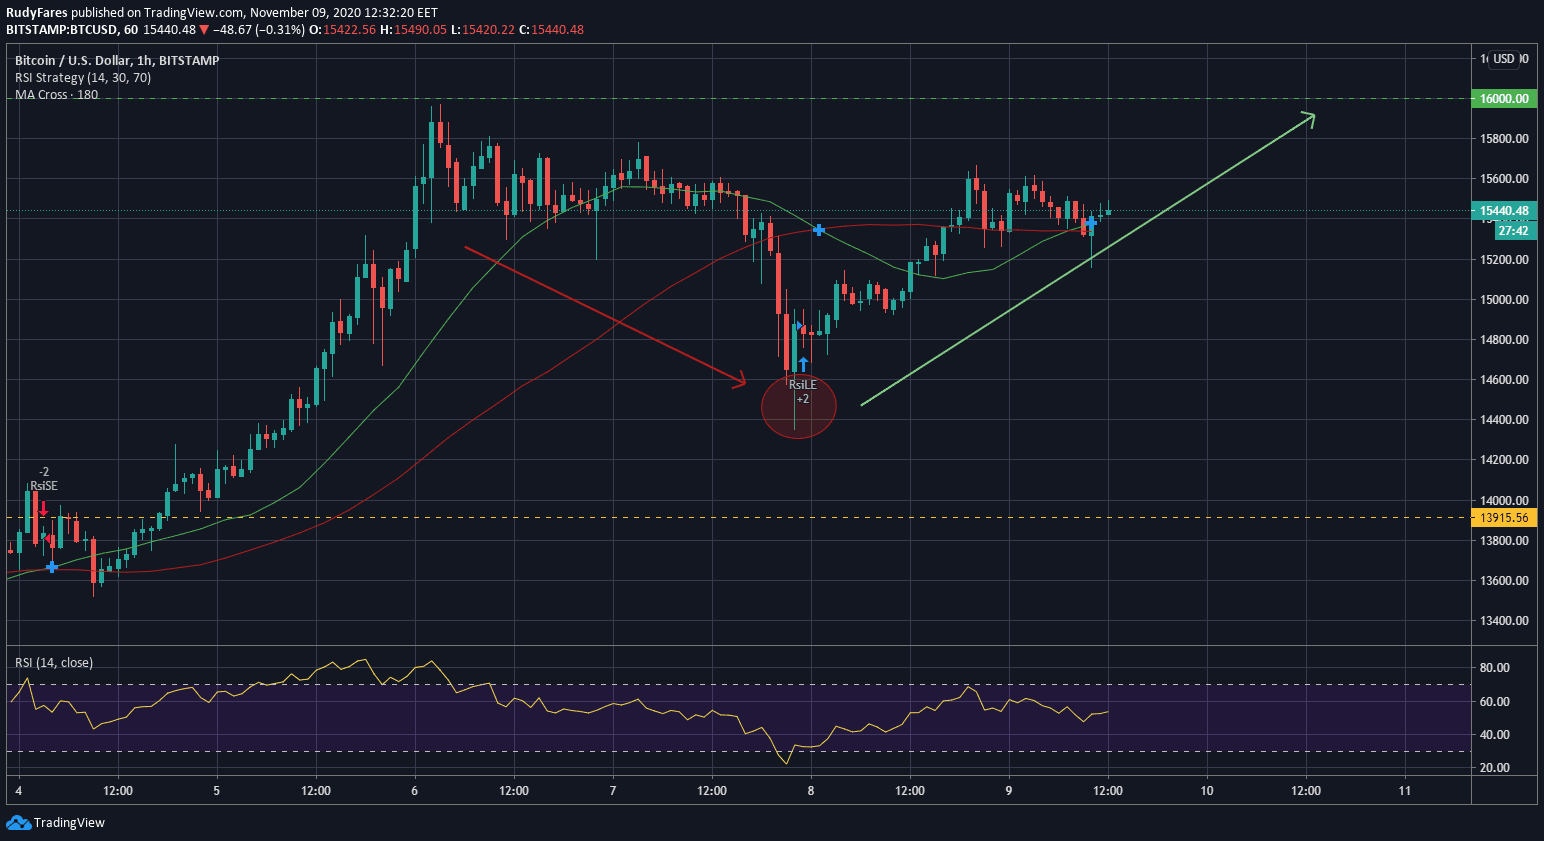
In figure 3, we see back on December 8th 2017 what happened ALSO during the weekend on a Friday, where prices went from an all-time high of USD 16,500 down to USD 12,600 on Saturday, only to recover back on Sunday and onward.
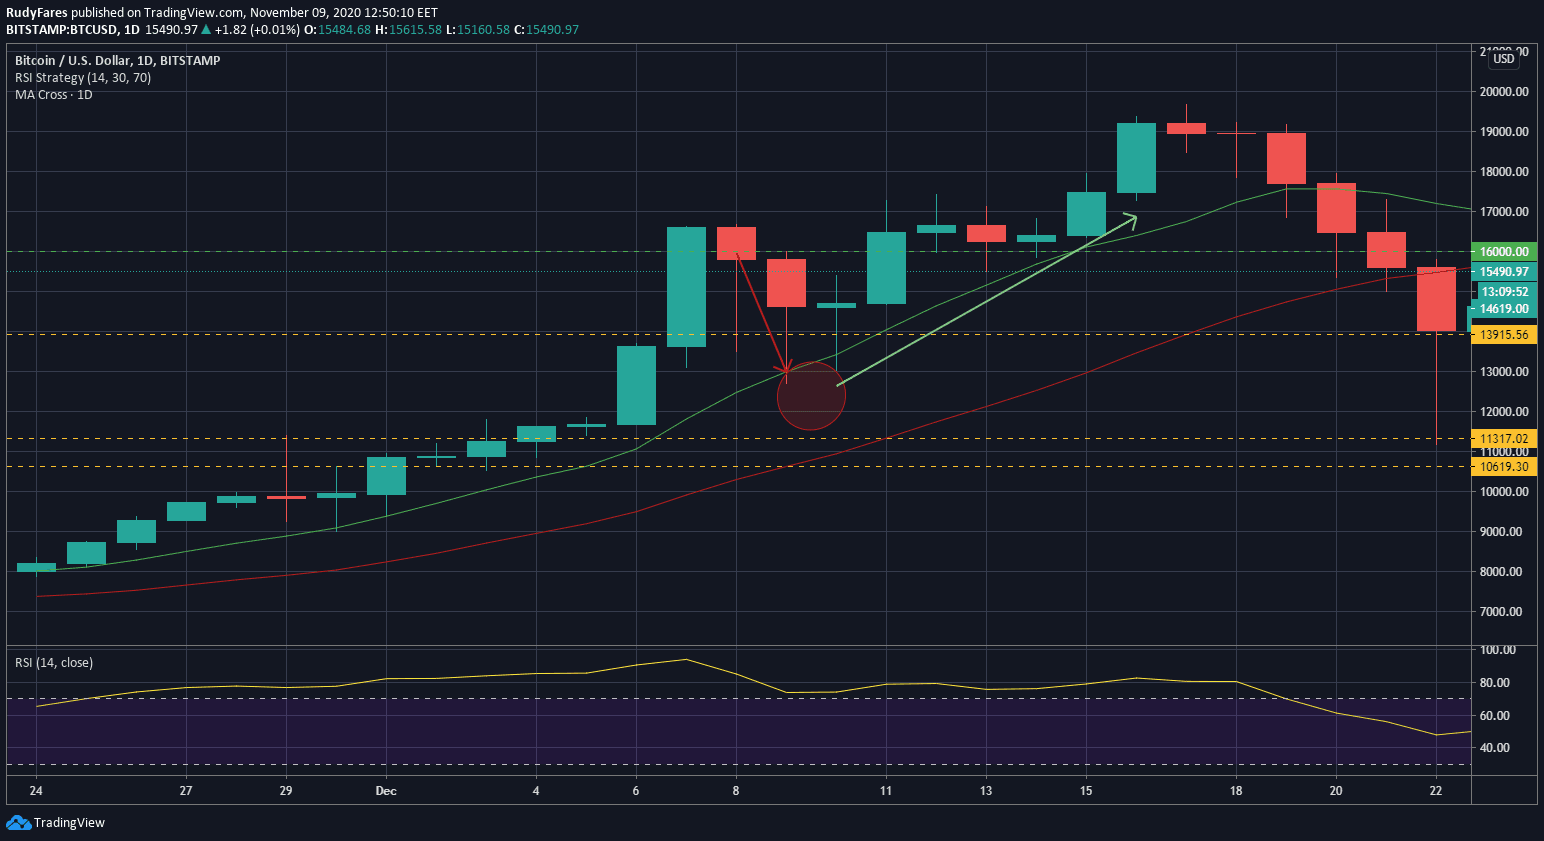
Similarly in figure 4, we see the same price-action from this past weekend.
The cryptocurrency market as a whole is UP
In the past 24 hours, the top 10 cryptocurrencies were all seen up for the day:
- Bitcoin (BTC) : + 3.1%
- Ether (ETH) : + 3.0%
- Tether (USDT) : 0%
- Ripple (XRP) : + 0.41%
- Bitcoin Cash (BCH) : + 4.98%
- Chainlink (LINK) : + 5.45%
- Binance Coin (BNB) : + 1.7%
- Litecoin (LTC) : + 2.6%
- Polkadot (DOT) : + 2.65%
- Cardano (ADA) : + 0.82%
Stay Ahead, Stay updated
Rudy Fares