XRP and BNB Prices Are On The Verge of Massive Breakouts
The cryptocurrency market has been relatively quiet in the past two days as it seems most cryptos are getting ready for a major price move. XRP and BNB have both established very clear patterns that will decide their future until […]

The cryptocurrency market has been relatively quiet in the past two days as it seems most cryptos are getting ready for a major price move. XRP and BNB have both established very clear patterns that will decide their future until the end of 2020.
XRP price is currently at $0.627 bounded inside a symmetrical triangle pattern formed on the 4-hour chart after the digital asset started to consolidated, following its 2020-high at $0.78.
Similarly, BNB price has created a long-term symmetrical triangle on the 1-hour chart which is extremely close to bursting.
XRP Price Analysis: Bulls are eying up $0.86
The current price of XRP at $0.62 is not really favoring anyone as it is right at the tip of the symmetrical triangle. Trading volume on Bitfinex and other exchanges has been dropping significantly since the peak on November 24 which also indicates the digital asset is on the verge of a major price move.
XRP/USD 4-hour chart – TradingView
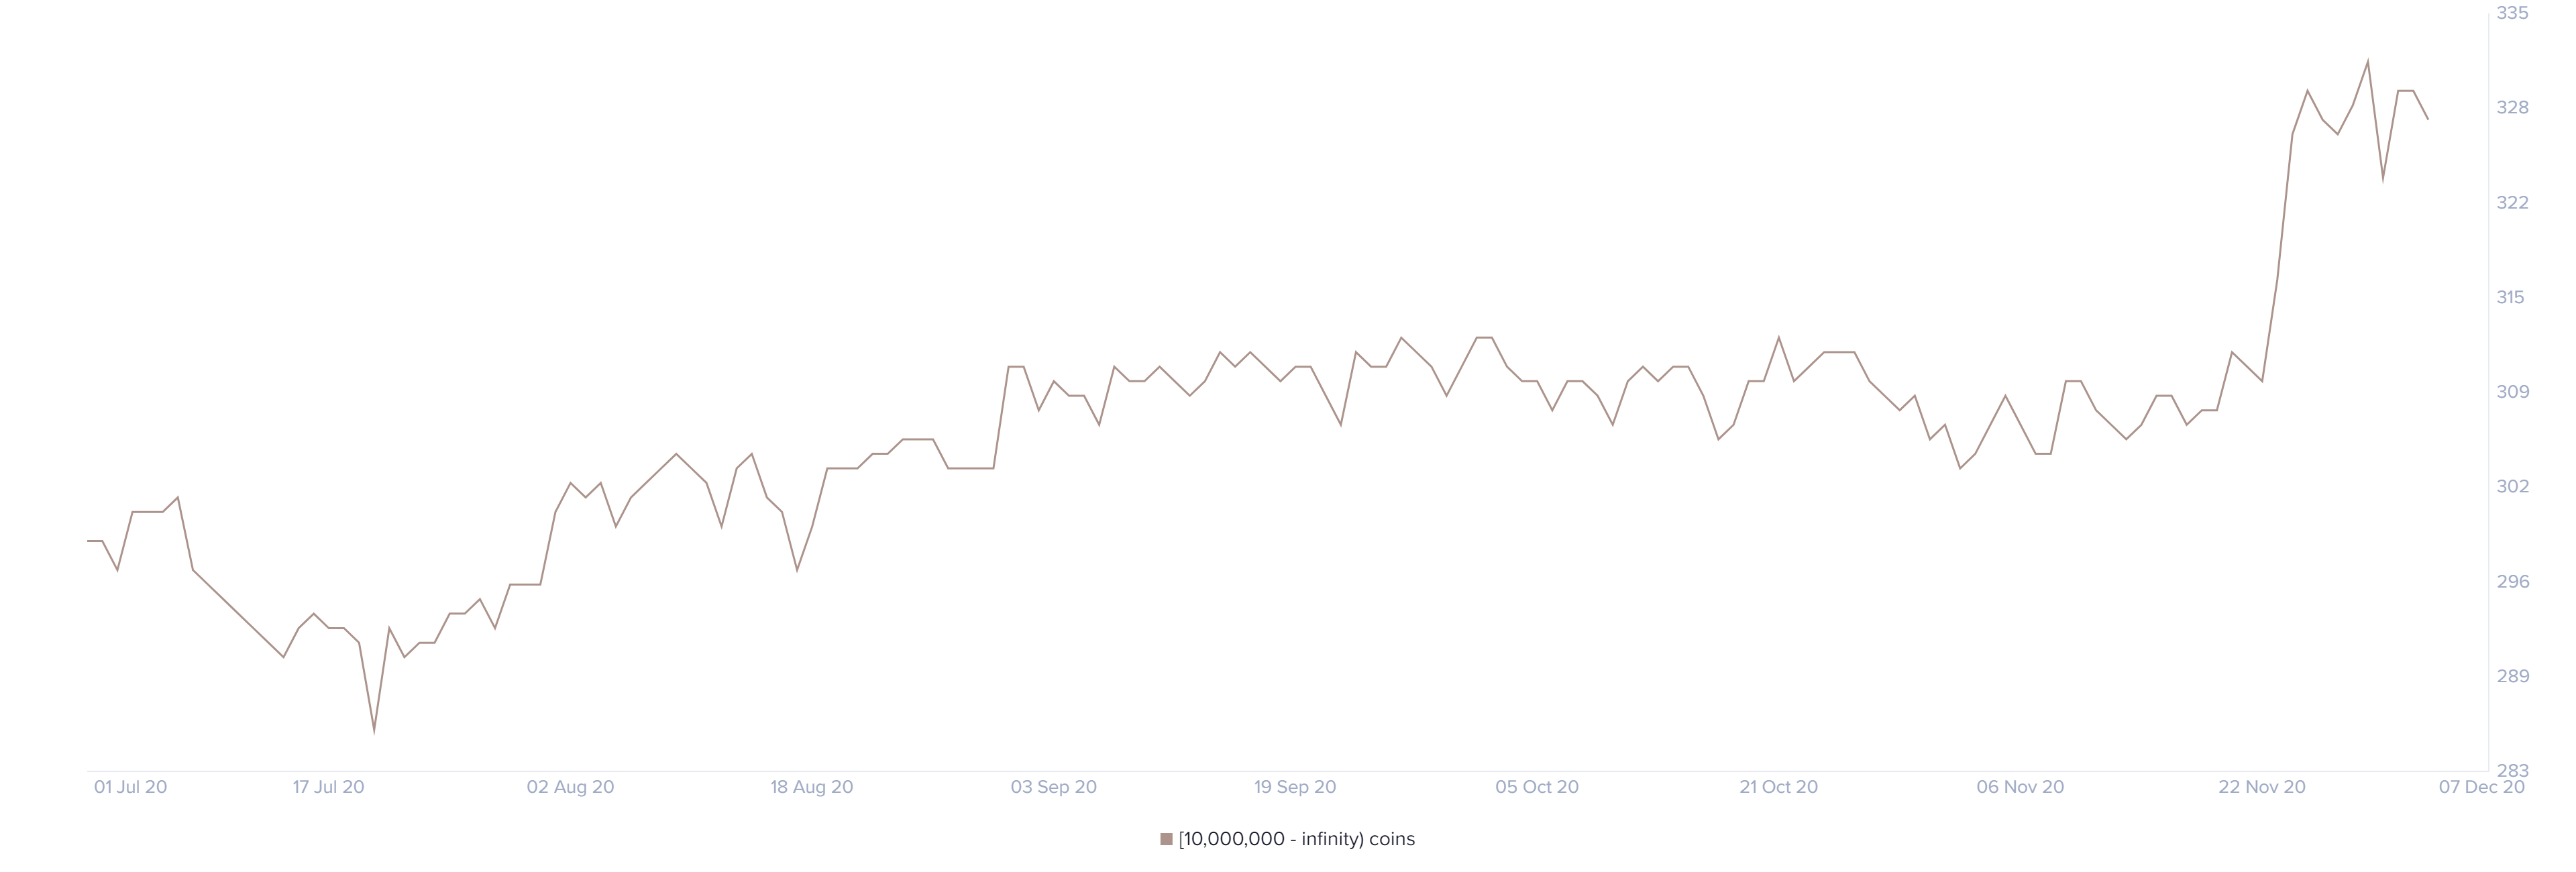
The most bullish metric for XRP is the significant increase in the number of whales holding at least 10,000,000 XRP coins ($6,200,000 or above) from a low of 286 on July 20 to a peak of 332 on November 29.

This metric shows that large investors are extremely interested in the digital asset despite its recent price growth. In fact, from November 22 to now, this number increased by 18 even though XRP established new 2020-highs.
A breakout above the triangle would push XRP price towards $0.87 while a breakdown would push it towards the psychological support level at $0.4.
BNB Price Analysis: Major price move is underway
Similar to XRP, Binance Coin price has formed a long-term symmetrical triangle on the 1-hour chart which is ready for a breakout or breakdown within the next 10 hours.
The trading volume is also declining which signifies the digital asset is on the verge of a major price move, but will it be to the upside?
BNB/USD 1-hour chart – TradingView
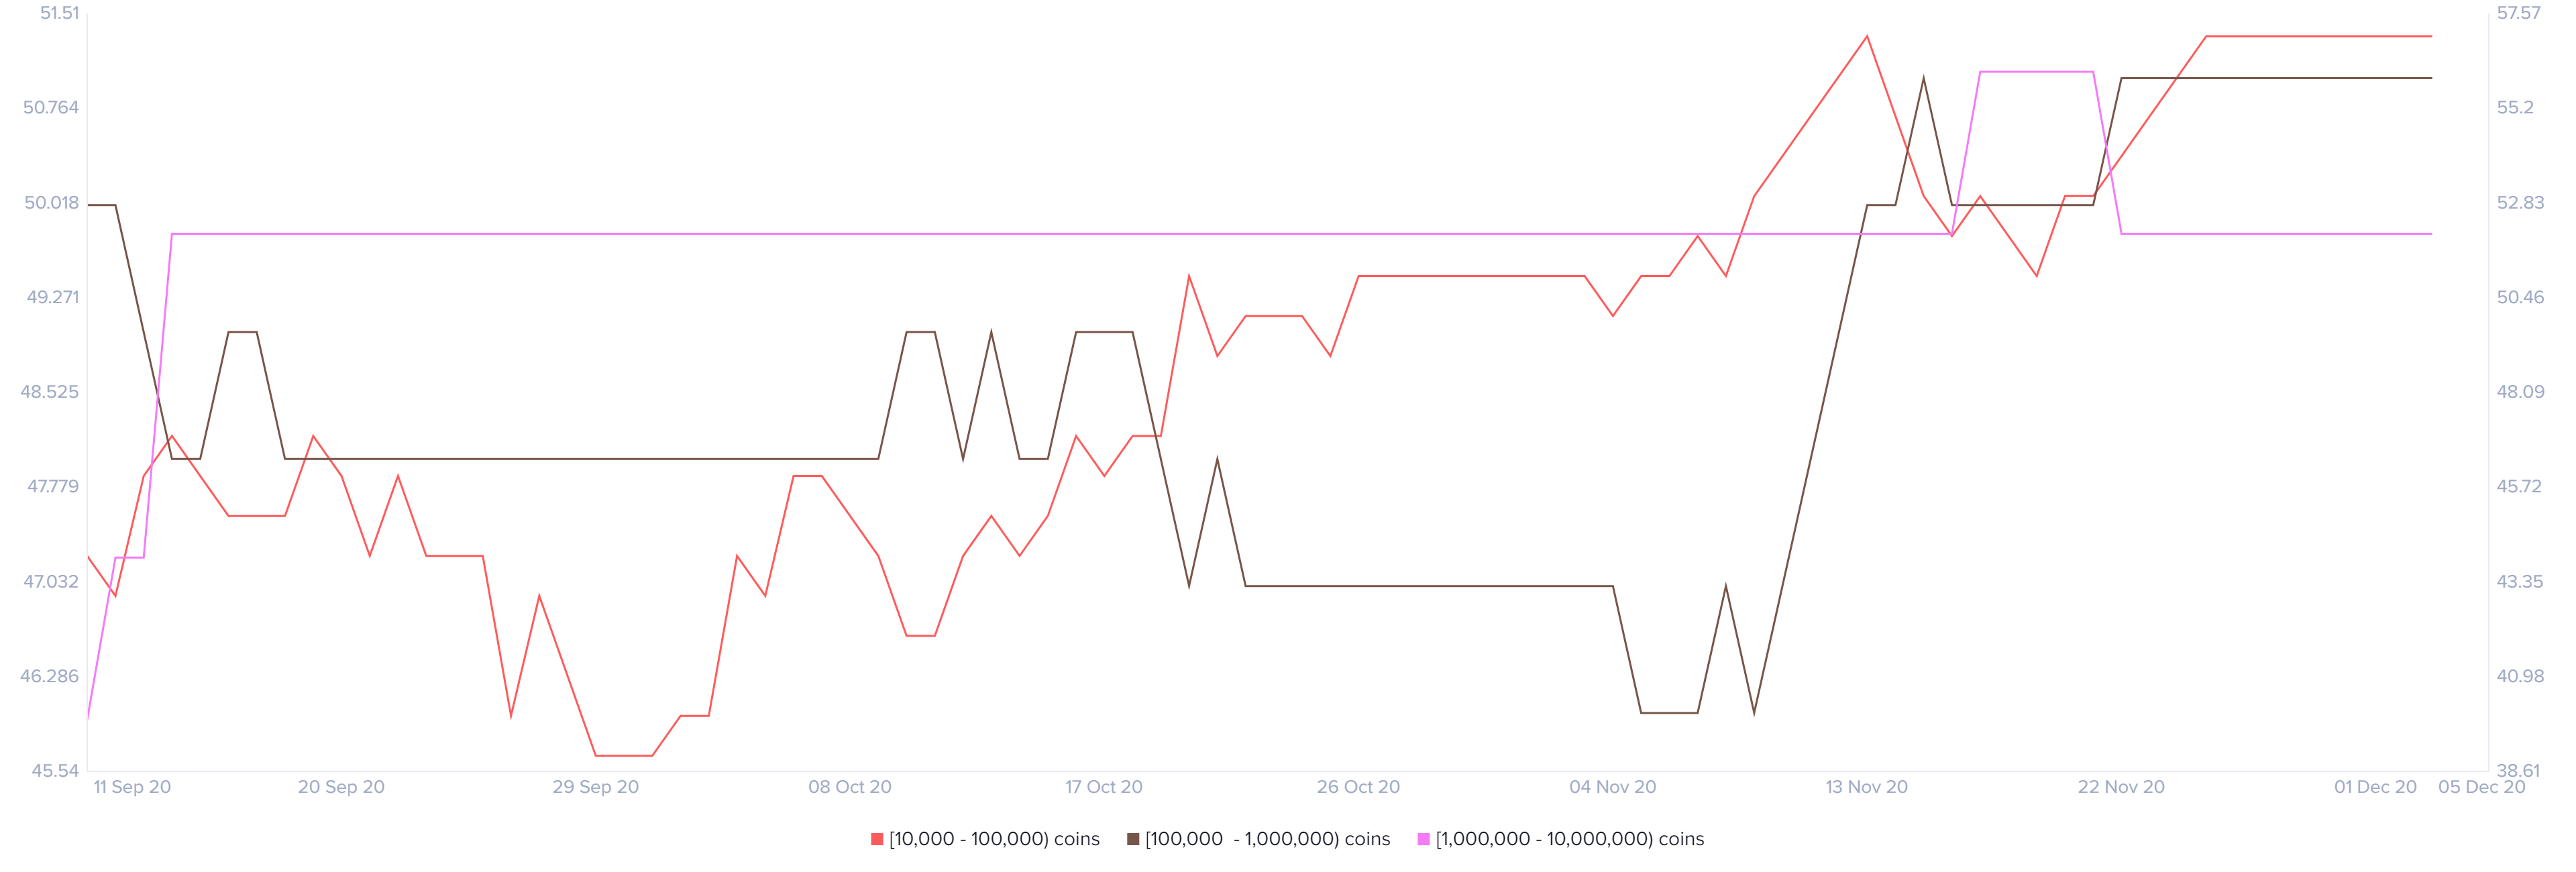
Interestingly, it seems that the number of investors holding BNB coins has increased significantly over the past two months.

For starters, smaller investors holding between 10,000 and 100,000 coins ($300,000 and $3,000,000) are on the rise from 39 on September 30 to 57 currently.
Larger whales that hold between 1,000,000 and 10,000,000 coins ($30,000,000 and $300,000,000) are also on the rise from 32 on September 11 to 35 currently. A massive increase considering the sum of money held. The number of hales with 100,000 and 1,000,000 coins also increased.
This would seem to suggest that bulls have a better chance of seeing a breakout, however, anything is possible. Bulls are targeting a high price of $37.7 after a breakout while bears are eying up $23.
Make sure to join our Trading Group on Telegram for more awesome tips!


