Binance Coin Price Analysis: BNB Price Is Showing Improvement
The Binance coin price is trading at $28.53 (+3.39%) on October 09, 2020. It seems that BNB price is sitting in the range of $27 to $29 for the past few weeks and once again trying to touch the $30 mark. Binance […]


The Binance coin price is trading at $28.53 (+3.39%) on October 09, 2020. It seems that BNB price is sitting in the range of $27 to $29 for the past few weeks and once again trying to touch the $30 mark. Binance coin was one of the best performing altcoins in September. In the last 30 days, the Binance coin price has increased by almost +16.2%. It seems that now it is trying to touch the $30 mark. Let’s take a look at it in more detail.
Binance Coin Price Analysis: BNB Price Daily Chart Looks Promising
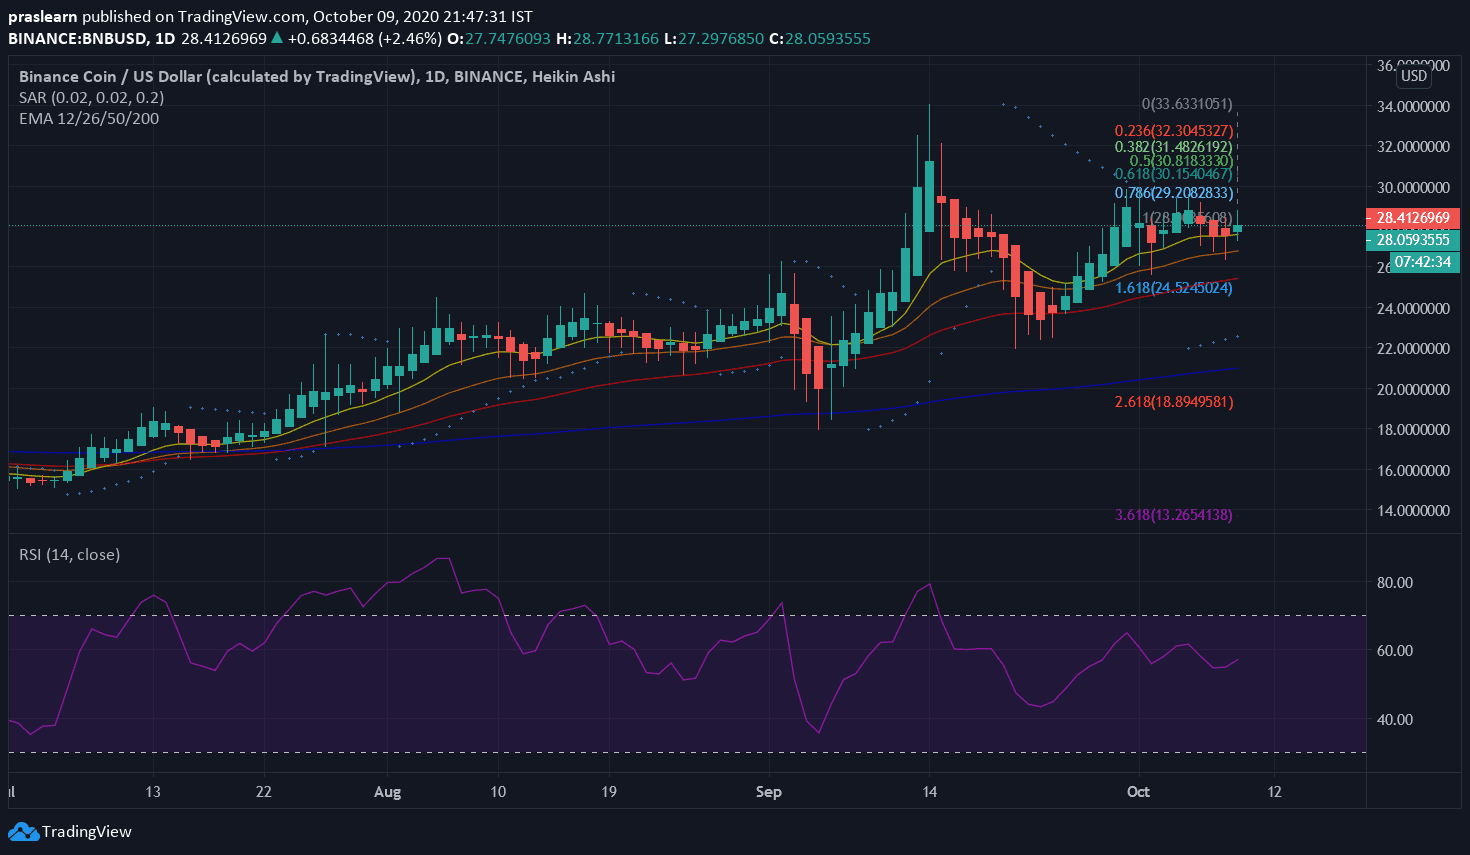
In the daily chart, the Binance coin price is displaying good improvements. The BNB price has comfortably jumped from an overextended RSI and climbing above all the four EMAs. This could be a positive sign. The next most crucial resistance level could be $29.20. The daily MACD is slightly bullish again but as mentioned earlier the price is sitting between the $27 to $29 range and it is crucial for BNB/USD price to crack the first resistance to go on the confirmed positive path. The key metrics are as follows:
- Price $28.51
- 24hr Change +3.32%
- 24hr Vol $109,735,489
- Liquid Marketcap $3,087,303,824
- Liquid Supply 108,345,641
Binance Coin Price Analysis: BNB Price Weekly Chart Is Looking Bullish
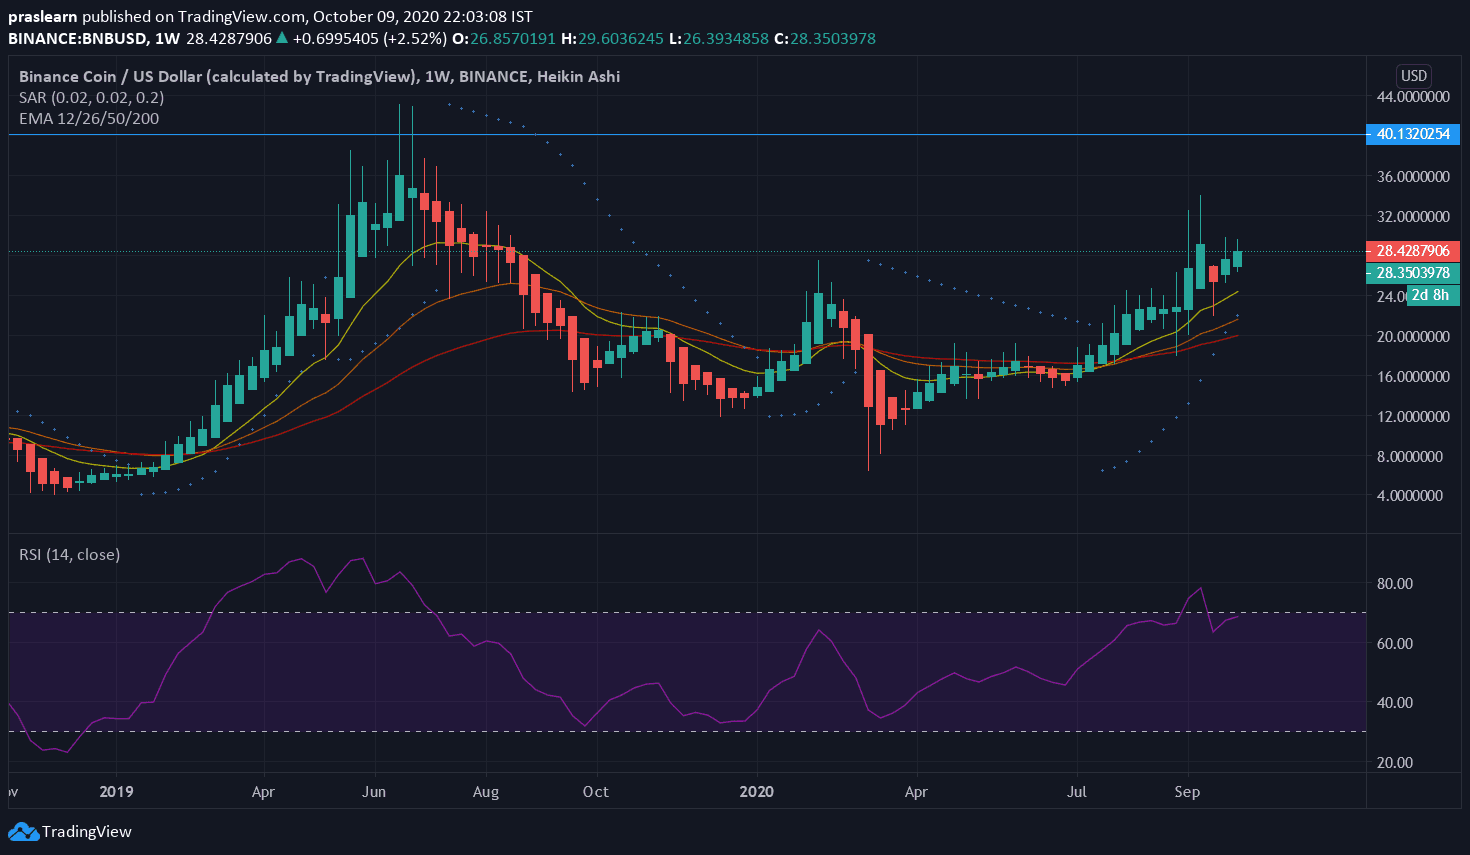
In the last week of September, the Binance Coin price collapsed and touched $23 and bounced to touch as high as $29.30 by the end of the month. As October began, BNB price went lower from this resistance but succeeded in finding stable support at the $27 level.
Now, if we see the weekly Parabolic SAR, then we will find that the dots have formed between the $6.79 to $21.65 price range. Despite the recent decline in the Binance coin price, it remains remarkably strong on the weekly chart as the weekly uptrend is sound. Bulls succeeded to defend the $24 support level where the 12-EMA is.
The BNB/USD weekly Parabolic SAR chart looks encouraging and showing a good upwardly sloping pattern. We can see that some dots have formed below and above the price and are climbing in an upwardly tilted pattern, this could imply an uptrend for Binance coin price.
Now, the thing with the SAR is that it could reverse once the price reaches its level. Hence, if SAR is further from price, withdrawal in the indicator is less expected. So, right now, the SAR is too far from the current Binance coin price, which could indicate that the BNB/USD price could increase in the next few days. So this could be a positive sign for the BNB price. We wish you happy trading!