Chainlink Price Breaks Out Of Critical Pattern Aiming For Higher Highs
Chainlink is currently trading at $12.87 after a massive breakout above a crucial pattern formed on the daily chart. The ascending wedge was established by the end of September and the upper boundary of the pattern acted as a strong […]


Chainlink is currently trading at $12.87 after a massive breakout above a crucial pattern formed on the daily chart. The ascending wedge was established by the end of September and the upper boundary of the pattern acted as a strong resistance level for close to a month before the final breakout today.
LINK is now trading above the 50-SMA and the 100-SMA and the MACD is gaining momentum while bulls are eying up the next price target at $13.26. It seems that above this level there is very little opposition stopping LINK’s price from reaching $18 again.
Chainlink Price Analysis: On-Chain Metrics
One of the clearest bullish metrics for Chainlink is the number of new addresses and active addresses. According to statistics provided by Intotheblock, the number of new addresses joining the chainlink blockchain increased by 21% in the past 7 days.
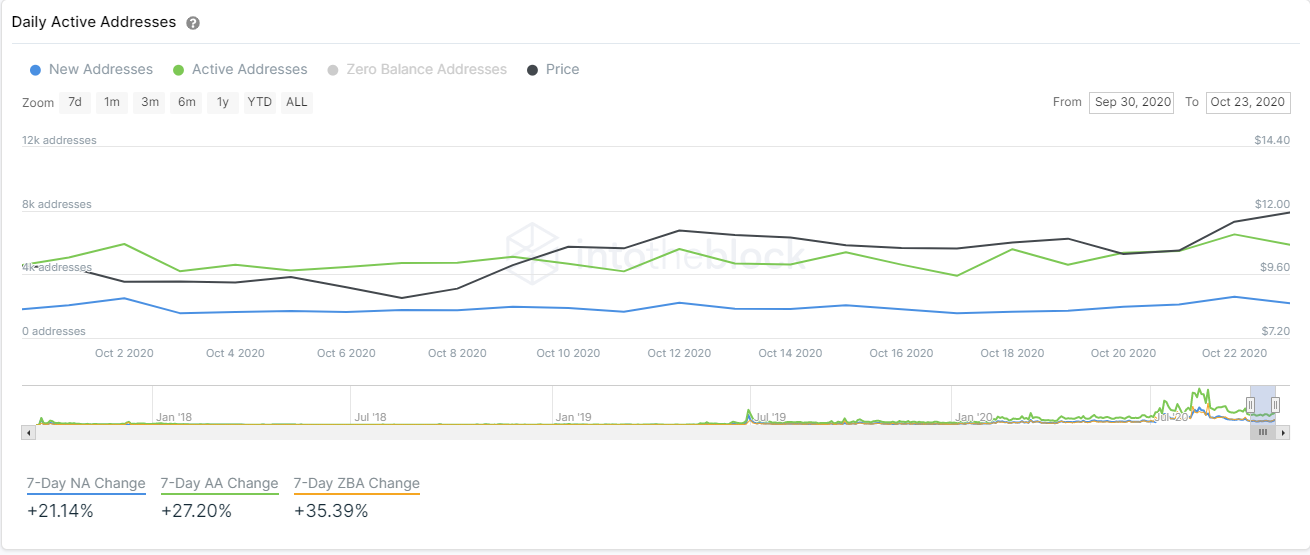
Similarly, the number of active addresses increased by a whopping 27% in the last 7 days. This notable growth signifies an increase in the interest in LINK by new and old investors.
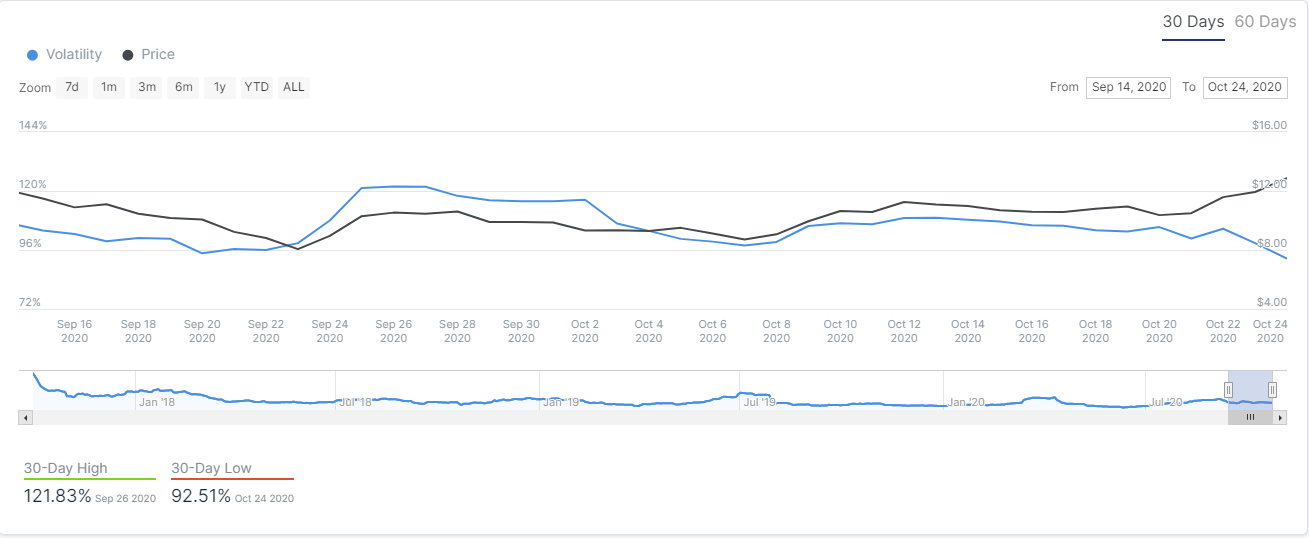
More importantly, it seems that LINK’s volatility is decreasing even though the price has seen a significant breakout. This usually indicates that the breakout was not caused by random volatility but rather a robust price action from investors.
Top 5 Stablecoins by Market Cap
Chainlink Price Analysis: Technical Indicators
As discussed above, the most important indicator for LINK is the breakout of the ascending wedge pattern formed on the daily chart. The 6% move in the past 24 hours confirms the semi-breakout that we saw yesterday.
LINK/USD Daily Chart – TradingView
The next price target seems to be $13.26, however, considering the magnitude of the breakout, the most likely scenario will be a breakout of this level in just one move. The entire crypto market flipped bullish in the past week which is also helping Chainlink’s momentum.
The RSI is close to overbought levels but as we have seen in the past, this hasn’t often represented a risk for the bulls, at least not in the short-term. When it comes to total trading volume, Coinmarketcap shows a notable increase in the past week from a low of $700 million per day to a recent peak at $1.85 billion.
This rise in volume in conjunction with the bullish breakout indicates that LINK is really strong currently.
LINK/USD Weekly Chart – TradingView
On the weekly chart, the price of LINK established a higher low at $7.28, however, the last high remains at $20. To continue with the current uptrend, bulls would need to crack the all-time high and climb higher.
The MACD seems to be shifting towards a bullish cross again after three weeks of positive gains while the RSI is not yet overextended. The other potential scenario for Chainlink will be establishing a lower high followed by a higher low again confirming an equilibrium pattern that would favor the bulls.