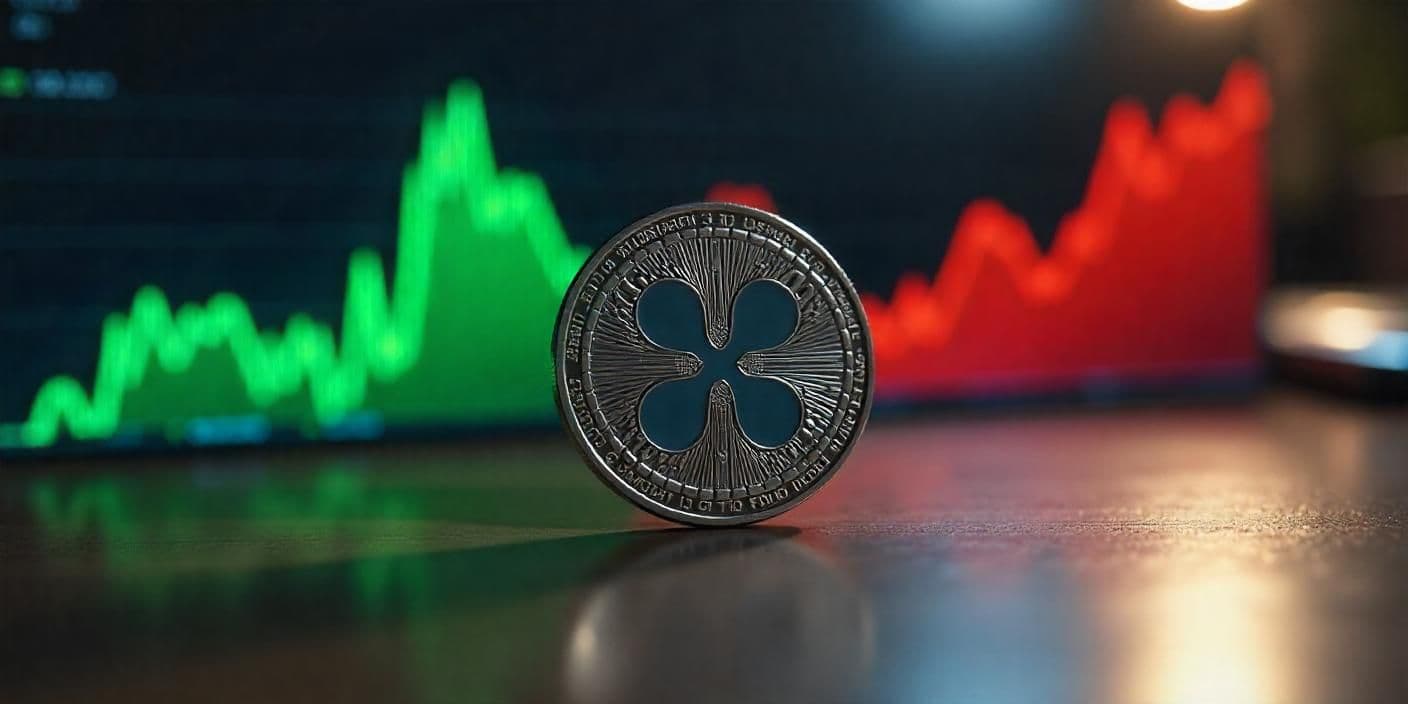
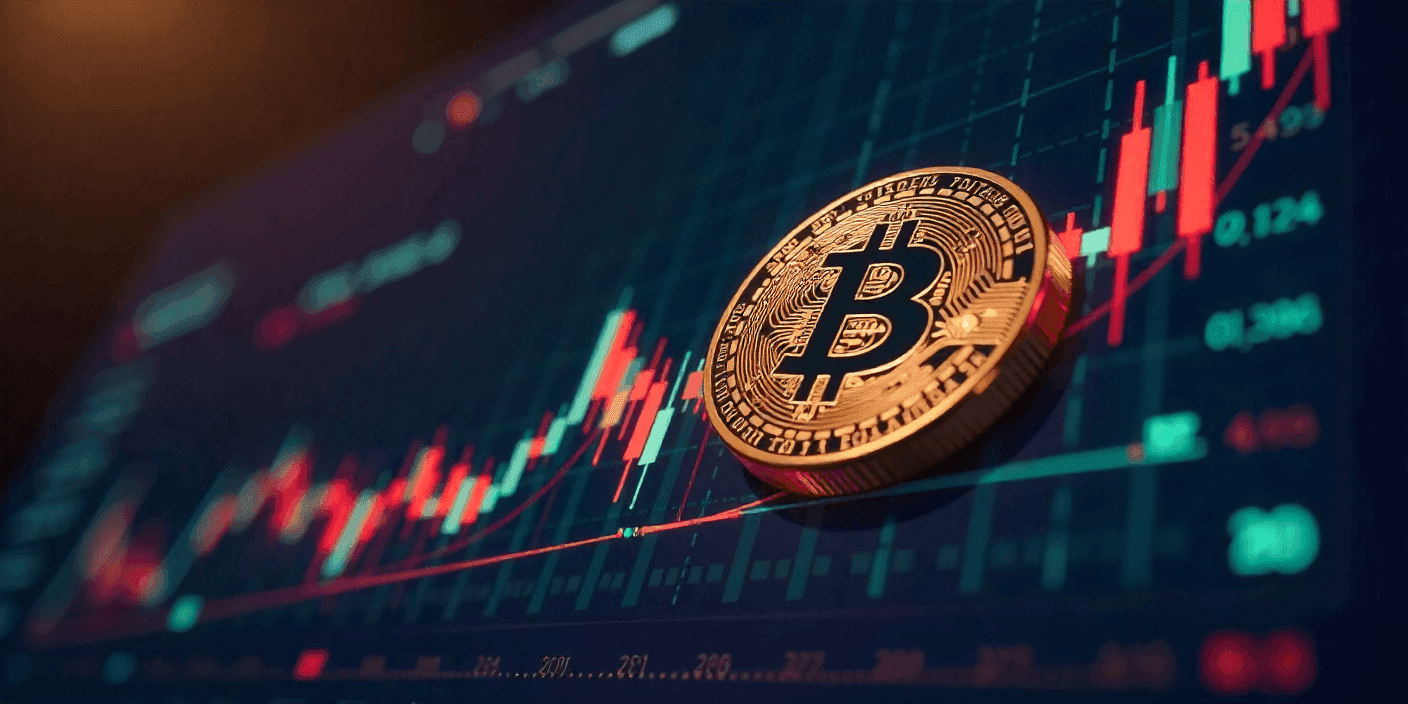
Top 3 Key Indicators that may influence Bitcoin’s Price this September
A few months back, Bitcoin was charging ahead breaking all the technical resistance that was put up by analysts, $4000, $6000, $9000 and finally it reached above 11K dollars. But since then, the market was sluggish and the prices withdrew […]


A few months back, Bitcoin was charging ahead breaking all the technical resistance that was put up by analysts, $4000, $6000, $9000 and finally it reached above 11K dollars. But since then, the market was sluggish and the prices withdrew below $11,000 again. Bitcoin has been unable to break away from the $11,000 resistance for a few weeks now. This has baffled many given the recent global market volatility. With the upcoming launch of the Bhakt platform, the market was expecting a bull rally but so far we have only experienced an indifference. Is it a sign that people are unwilling to buy Bitcoins at a higher price, or is it a sign of an upcoming rally like in early 2017 (when Bitcoin first breached the $1000 mark)?
Technical analysis for crypto
From the day the VIX (Volatility Index) was introduced by the Chicago Board Options Exchange (CBOE), investors, research analysts and portfolio managers have relied on it heavily. VIX is looking into it as a way to measure market risk, fear, and stress before they take investment decisions. Most such indexes are aimed at bond or equity, but recently a few have been used to look into crypto. In this article, we will go through three such indicators Crypto Fear & Greed Index, the Bitcoin Golden Ratio Multiplier and Bollinger Bands. Each of these dives deep into a specific portion of the market and can be taken into account while predicting the movement of the market in the future.
Alternative.me
This is a site that provides the Crypto Fear & Greed Index (CFGI). Their homepage has this message, ”Each day, we analyze emotions and sentiments from different sources and crunch them into one simple number: The Fear & Greed Index for Bitcoin and other large cryptocurrencies”, which pretty much sums up what they do. The index maps investor sentiment on a scale of 1 to 100 where 1 represents investors’ sense of doom and 100 reflects sheer optimism and greed. Although the index is currently at 30 (fear), it is better than last week when it was 11 (extreme fear). This suggests that the emotions surrounding Bitcoin and other major cryptocurrencies are improving. If we take a closer look at how CFGI has progressed over the weeks, it becomes apparent that whenever Bitcoin hits above $11,000, CFGI falls into extreme fear and recovers to fear once Bitcoin falls below that mark. This indicates that the market, in general, is not yet comfortable with Bitcoin going above $11,000.
Bollinger Bands
Bollinger Bands are a technical analysis tool. Specifically, they are a type of trading band or envelope. Trading bands and envelopes serve the same purpose, they provide relative definitions of high and low that can be used to create rigorous trading approaches, in pattern recognition, and for much more. The band is usually thought of as employing a measure of central tendency as a base such as a moving average, whereas envelopes encompass the price structure without a clearly defined central focus, perhaps by reference to highs and lows, or via cyclic analysis. We’ll use the term trading bands to refer to any set of curves that market technicians use to define high or low on a relative basis. Looking at the Volume Profile Visible Range (VPVR) we can predict that in short term Bitcoin could drop to 8,750 to $7,500. On a day to day basis, the number of sell in volume term is outpacing the volume of buy, along with this Bollinger bands are tightening. This suggests a sharp change in Bitcoin prices.
Golden ratio
The Golden Ratio is a natural phenomenon of proportion and symmetry resulting from a pattern of numbers called the Fibonacci sequence. You can apply the Golden Ratio, also referred to as Phi, to anything from the human face to a snowflake. In the case of cryptocurrency, analysts use the Golden Ratio to examine major price movement trends for the market as a whole or for a particular coin. To do it in Bitcoin’s case, we multiply the golden ratio with the daily moving average (of Bitcoin) of 350 days and compares it with the result of multiplying the same daily moving average (DMA) with numbers in the Fibonacci sequence. Currently, Bitcoin is between 1.6*DMA and 2*DMA, these two are termed as green (accumulation) and red (low bull) respectively.
Most of these indicators are new and it is possible that you haven’t even heard of them. In fact, such indicators for crypto is rather an unknown fact for most of the world except for those involved in serious investments in crypto. The numbers from all three indicators are a positive sign. All technical analysis points towards a bull rally in the future, but Bitcoin has a history of unpredictability. And investors should watch out for it, one shouldn’t totally rely on numbers and predictions, any equity trader will be quick to point out that modern markets are not about fundamentals but more about emotions.
Follow us on Twitter, Facebook, Steemit, and join our Telegram channel for the latest blockchain and cryptocurrency news.