Ripple Price Analysis: What’s Next For XRP Price?
The Ripple price is slightly in the green zone for the past 7 days. The latest XRP price is $0.244 on October 08, 2020, and it has increased by almost +2.71% in the last 7 days. It seems that the price could […]


The Ripple price is slightly in the green zone for the past 7 days. The latest XRP price is $0.244 on October 08, 2020, and it has increased by almost +2.71% in the last 7 days. It seems that the price could be showing bullish behavior and it is in an uptrend but there are still some things to conquer. Let’s take a look at it in more detail.
Ripple Price Analysis: XRP Price Daily Chart Still Struggling
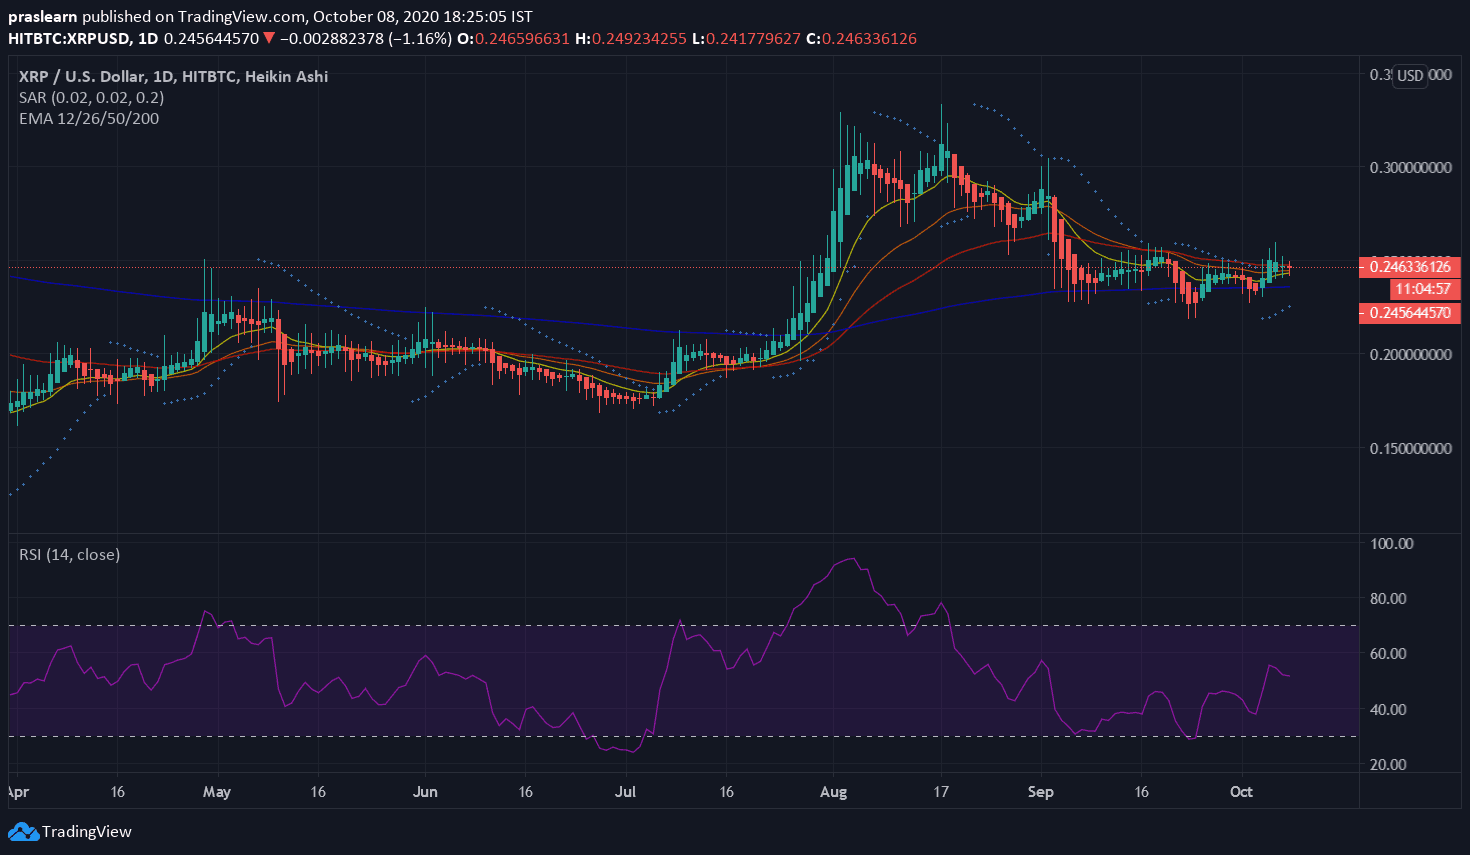
In the last 24 hours, the Ripple price failed to crack the crucial resistance of $0.251. The price bounced from an increasing trend line on Sunday that observed the XRP breaking above the 100-days EMA to touch the resistance at $0.251 (bearish .786 Fib Retracement). Now, in the last 7 days, XRP/USD price was accomplished to head as high as $0.26 but is still further to secure a daily candle above the bearish .786 Fib Retracement.
Now, if we observe the daily chart, then it could be displaying a slight downtrend for XRP. The 12-EMA could be serving as a strong resistance level even though the price has risen above it numerous times. The other critical resistance feature is the 26-EMA which has denied the price almost 6 times now. if we closely observe the daily Parabolic SAR chart then it slightly looks promising. We can see that some dots have formed below the current price and dots are displaying increasing pattern, this could suggest an uptrend for the XRP price in the short-term.
Ripple Price Analysis: XRP Price Weekly Chart Is Crucial
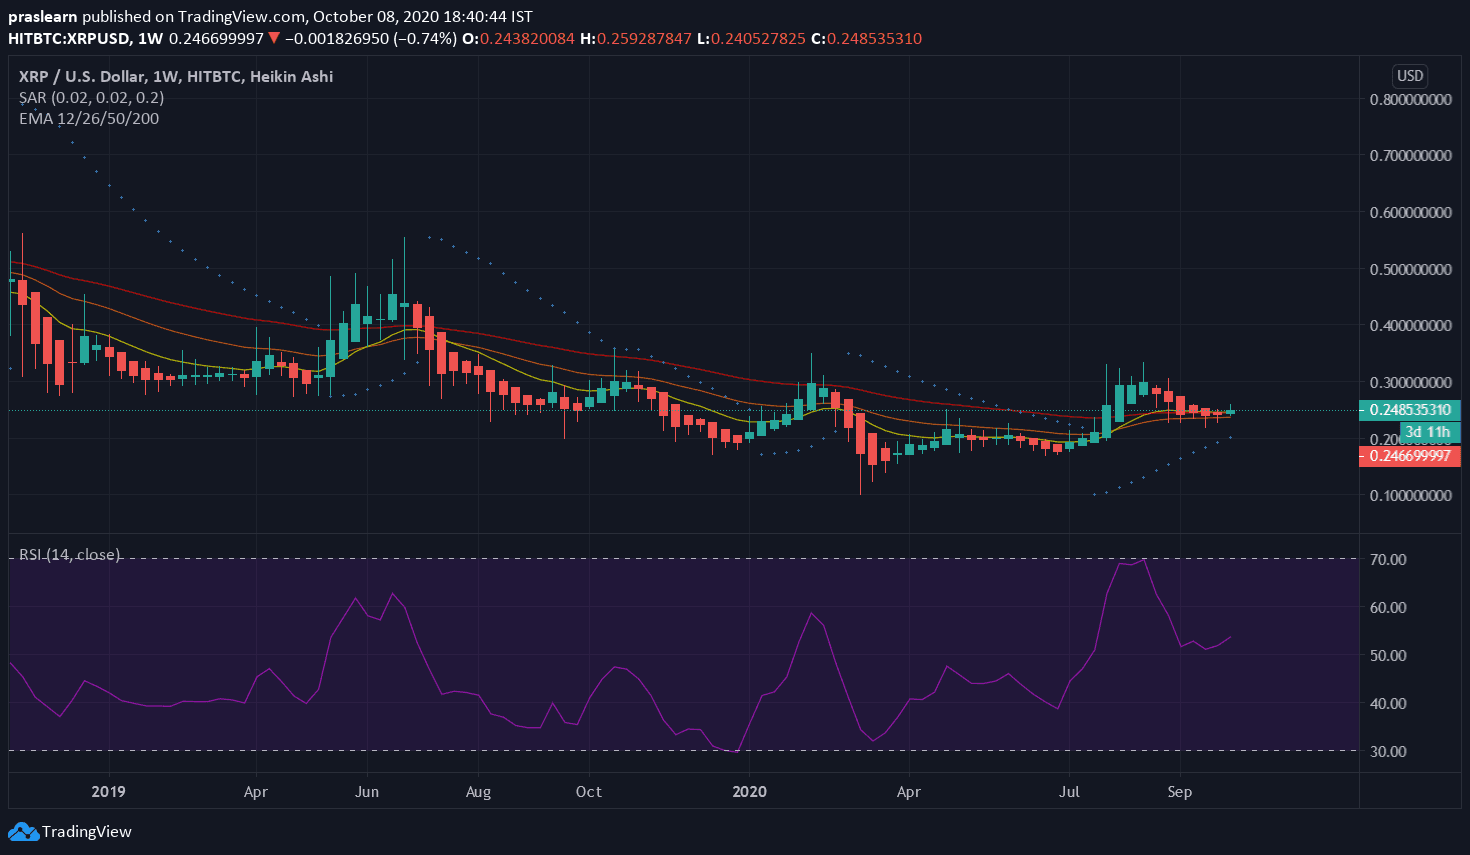
Now, if we closely observe the Ripple price weekly chart then its long-term could be promising. The slight uptrend formed could be healthy as the last low is around 0.171. Any level above 0.171 could be a higher low and a resumption of the uptrend. Also, the bulls have been strong to keep the 12-EMA on various occurrences. Overall trading volume is declining, this could be a bullish flag as a pullback is more efficient.
If the bulls desire to notice a drive shift, they will want to push the Ripple price above the 12-EMA and the 26-EMA, transform both into support levels and maintain trading upwards until they form a bull cross. A bullish breakout above $0.25 could take XRP up to $0.30 in the long-term if the RSI doesn’t get too overextended.
Conclusion
For now, XRP price needs to stay above all the EMAs and stop them from joining bearishly. The 50-EMA is also right in between them and it was turned into support and could be helping the price to bounce back.