
Is Stellar a Good Buy at Current Prices?
Stellar trades back above both moving averages but still far below its yearly high. What the chart, the RSI, volume and supply mechanics mean for an entry. What speaks for buying at the current price — and what against it.





Which topics should we dive deeper into?
Select what genuinely interests you. Your picks feed directly into our editorial planning.
Crypto news that's actually worth your time.
Weekly. 60 seconds. Carefully curated by our editors: no hype, no promo flood, no spam.
Stellar trades at around 0.2285 US dollars on 29 September 2026. That is 44.3 percent below the twelve-month high of 0.4100 US dollars set on 7 October 2025, and 59.4 percent above the twelve-month low of 0.1433 US dollars from 23 May 2026. The sixteenth-largest crypto asset by market capitalisation therefore sits in the lower third of its yearly range, after a recovery of 30.9 percent in four weeks. Is Stellar a good buy at current prices, or has the move already happened?
All price figures in this article are as of 29 September 2026.
Stellar price analysis: where XLM trades and which levels matter
The Stellar price of 0.2285 US dollars sits above both moving averages, which have converged almost exactly. The 200-day average stands at 0.1931 US dollars and thus 15.5 percent below the current price. The 50-day average stands at 0.1929 US dollars, 15.6 percent below. The nearest level to the upside is the interim high of this recovery at 0.2322 US dollars, reached on 29 September.
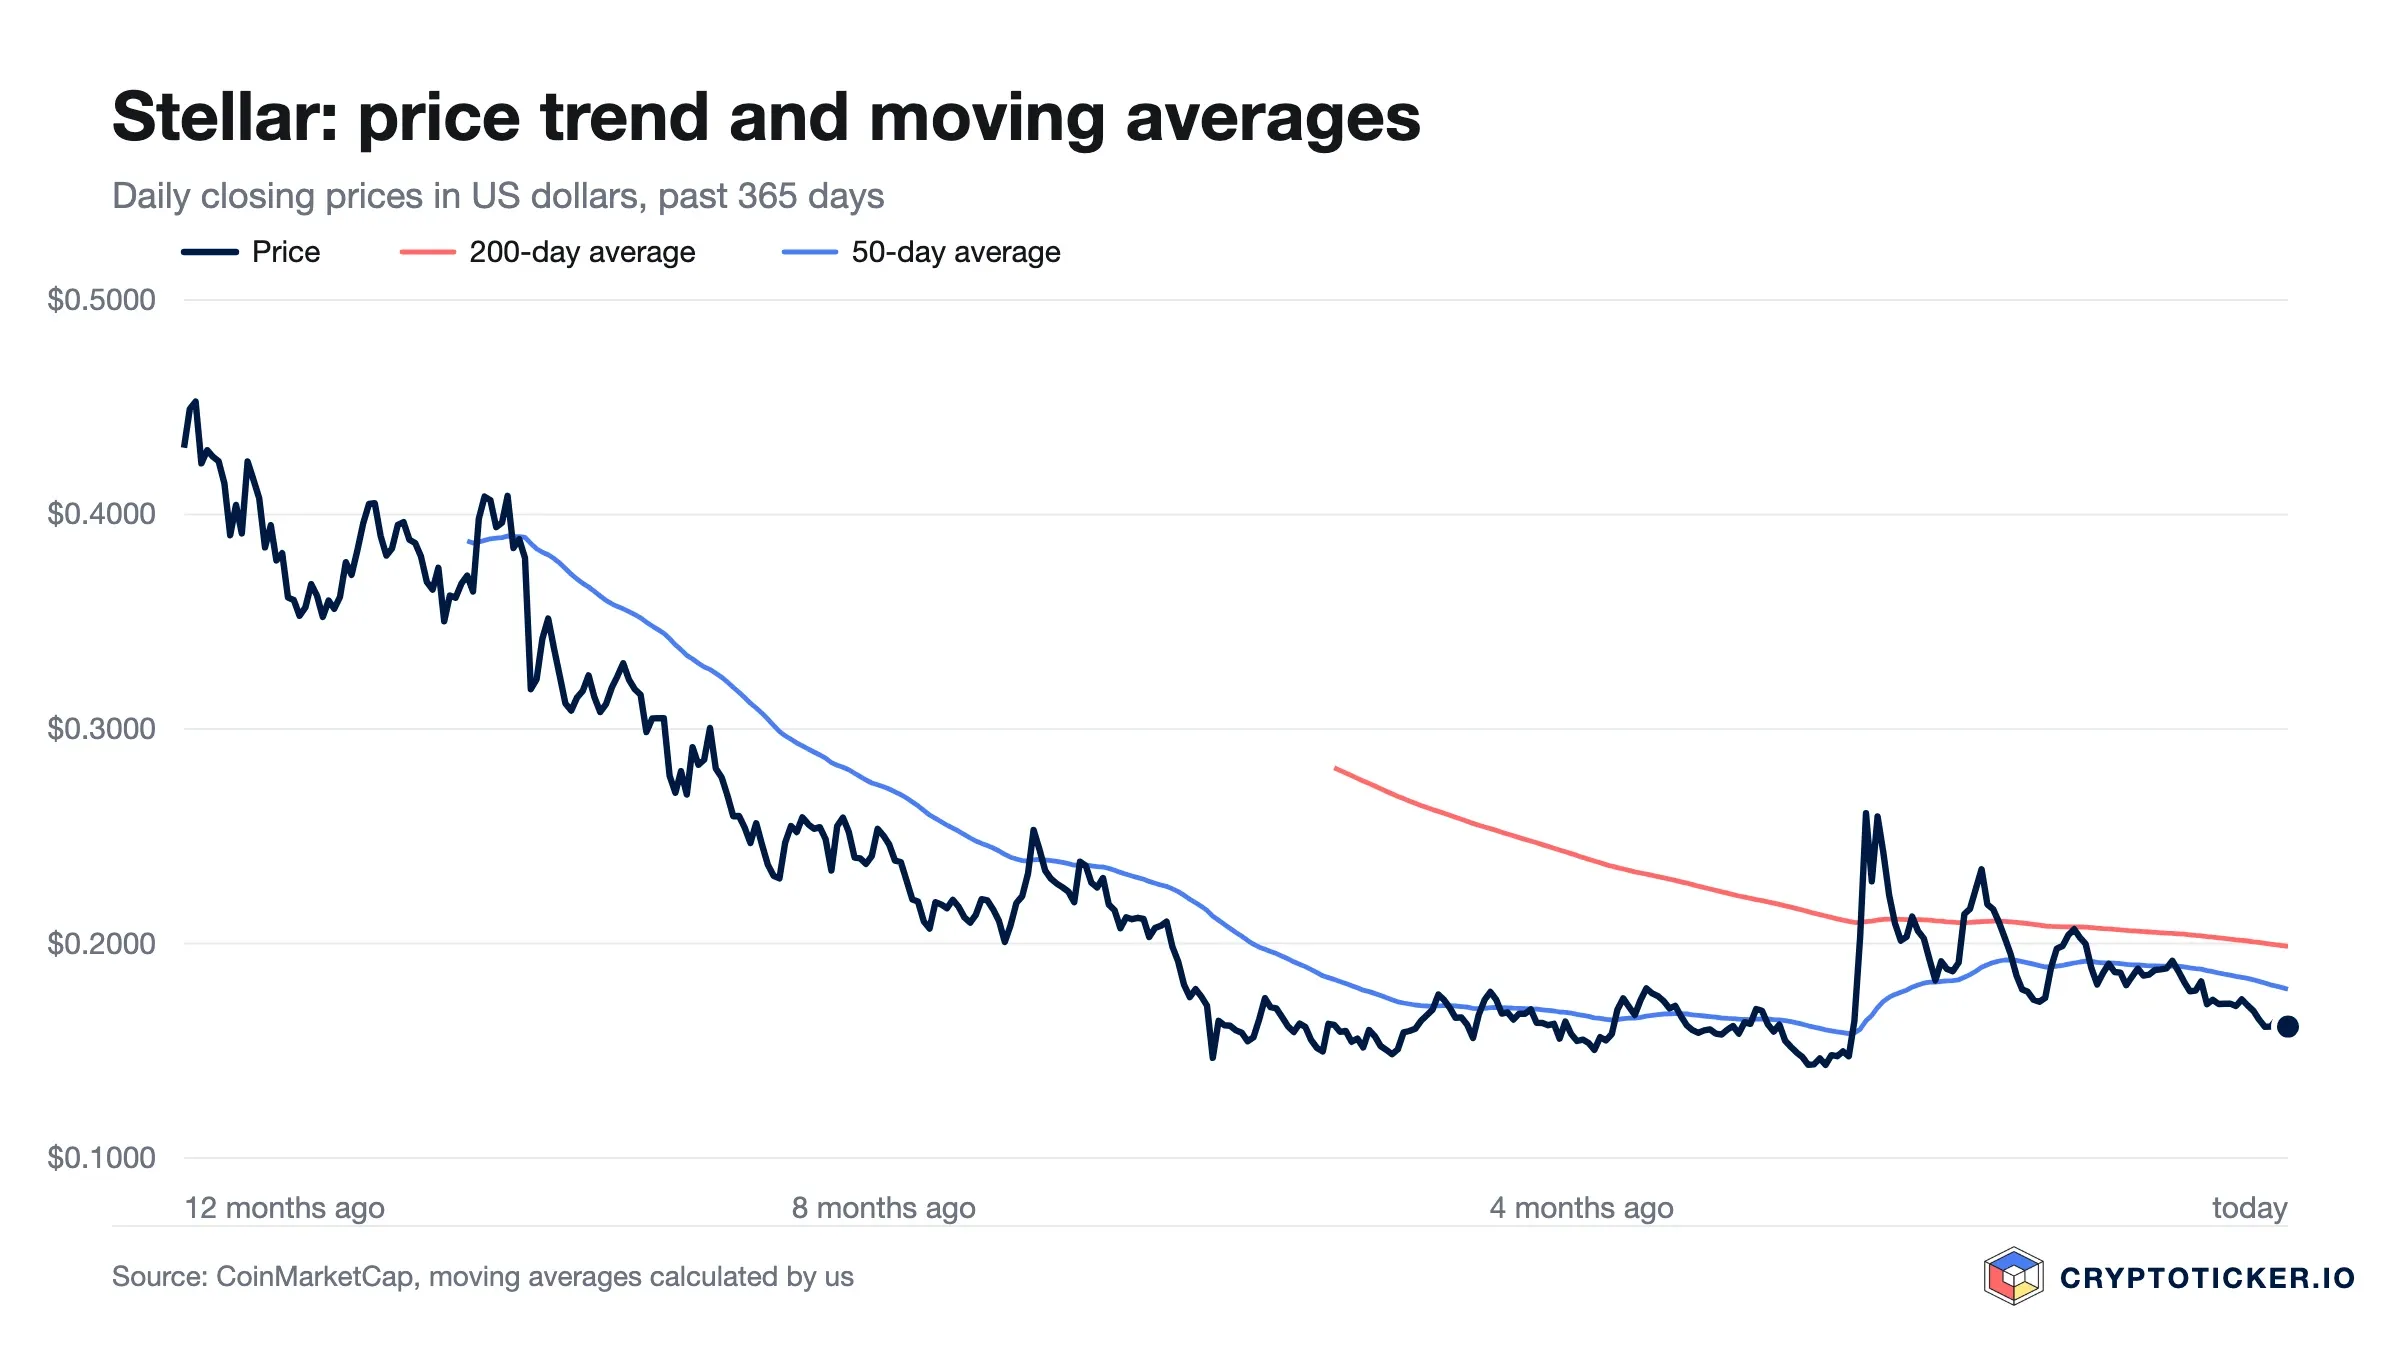
The past 30 trading days span a range of 32.9 percent, from 0.1747 US dollars on 11 September to 0.2322 US dollars on 29 September. Within that range the price has moved to the upper edge, and the seven most recent closes all fall between 0.2021 and 0.2322 US dollars. A market that widens in this way has found a reason to move, and the burden of proof shifts to whether the move holds.
Below the current price the market barely traded between 0.2000 and 0.2300 US dollars over the past year, which means there is little accumulated support in that stretch and the two moving averages around 0.1930 US dollars are the first real floor. Longer-dated scenarios are collected in our Stellar price prediction.
Is the Stellar downtrend broken or only interrupted
The quarterly figures have turned. Over 90 days the price is 16.1 percent higher, over 30 days 30.9 percent higher, and over twelve months it is still down 37.3 percent. The picture is one of a market that stopped falling in the spring and has now begun to rise.
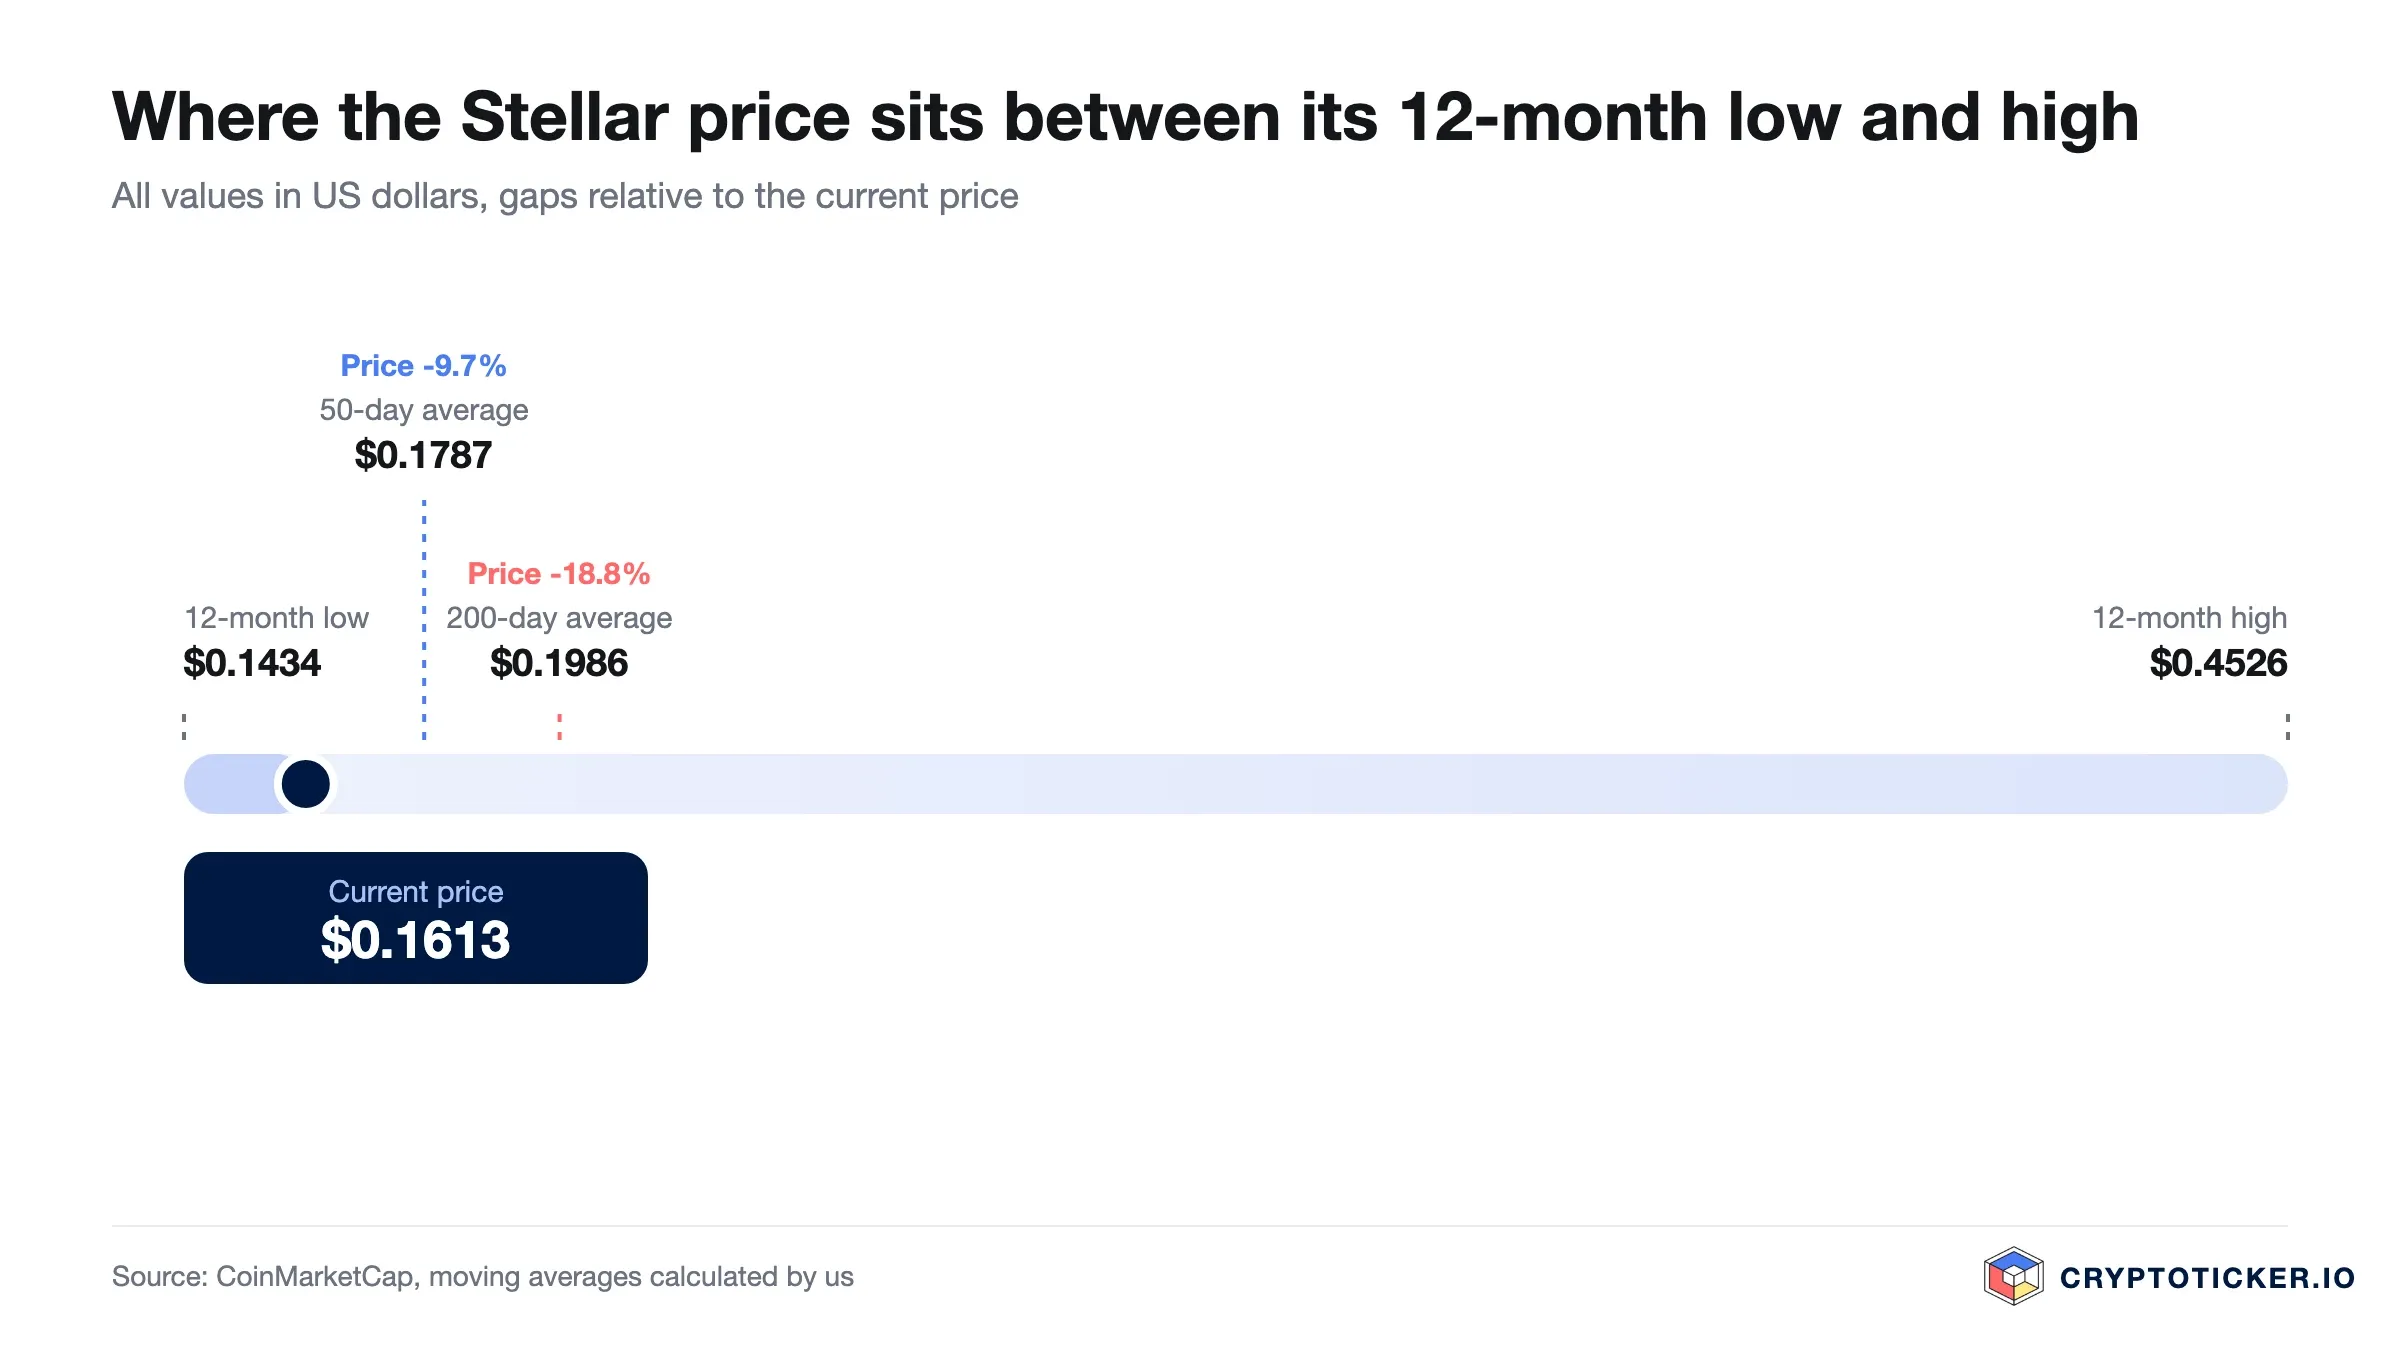
The sequence matters. Stellar found its low at 0.1433 US dollars on 23 May 2026 and recovered to 0.2600 US dollars by 1 June. It gave that back into mid-September, but the pullback stopped at 0.1747 US dollars on 11 September, well above the May low. A downtrend counts as broken once a market sets a higher low and then clears its previous high; Stellar has now managed both halves of that condition.
The most plausible reading in our view is a reversal that is under way but not yet sealed. The price has closed above the 200-day average since 19 September and above the 50-day average since 17 September, which argues against a continuation of the fall. The 50-day average at 0.1929 US dollars still sits a hair below the 200-day average at 0.1931 US dollars, so the crossover that would confirm the turn has not happened. Both statements are assumptions drawn from the chart.
What RSI and moving averages mean for a Stellar entry
The RSI over 14 days stands at 65.8 points. Readings above 70 are conventionally treated as overbought, so Stellar is close to that zone without having entered it. An RSI at this level tells you that buyers have been in control for several weeks, and it does not tell you how much longer that lasts.
The two moving averages are stacked below the price. With the 50-day average at 0.1929 US dollars and the 200-day average at 0.1931 US dollars almost level, and the price 15.5 percent above both, the short-term structure points up while the longer-term structure is still in transition. That configuration replaced the downward structure of the spring in mid-September.
For an entry this has two practical consequences. Buying at 0.2285 US dollars means buying with the trend but after a 30.9 percent move, which historically requires either patience through a pullback or a wider stop. Waiting for a return to the averages means a potential entry 15.5 percent lower for a market that would then have given back part of its evidence. The two routes price risk and certainty differently.
What Stellar trading volume reveals about demand
Turnover over the past 24 hours amounts to 855.0 million US dollars against a market capitalisation of 8.05 billion US dollars, a turnover rate of 10.6 percent. The 30-day average sits at 272.2 million US dollars per day. The 90-day average is 212.6 million US dollars, and the average across the full year is 209.4 million.
The comparison is the informative part. Current turnover runs at roughly three times the 30-day average and four times the 90-day average. Trading interest in Stellar has returned sharply since the spring, and the return coincides with the move off the yearly low.
Heavy volume cuts both ways for a buyer. A move carried by turnover is usually more durable than one that rests on a thin market, so the evidence for the recovery is stronger than it was in August. The same surge also shows that short-term participants are active, and their positions leave as fast as they arrived. Where trading costs are lowest differs by venue, and our exchange comparison sets the fee models side by side.
Structural factors that speak for Stellar: supply mechanics, usage and regulation
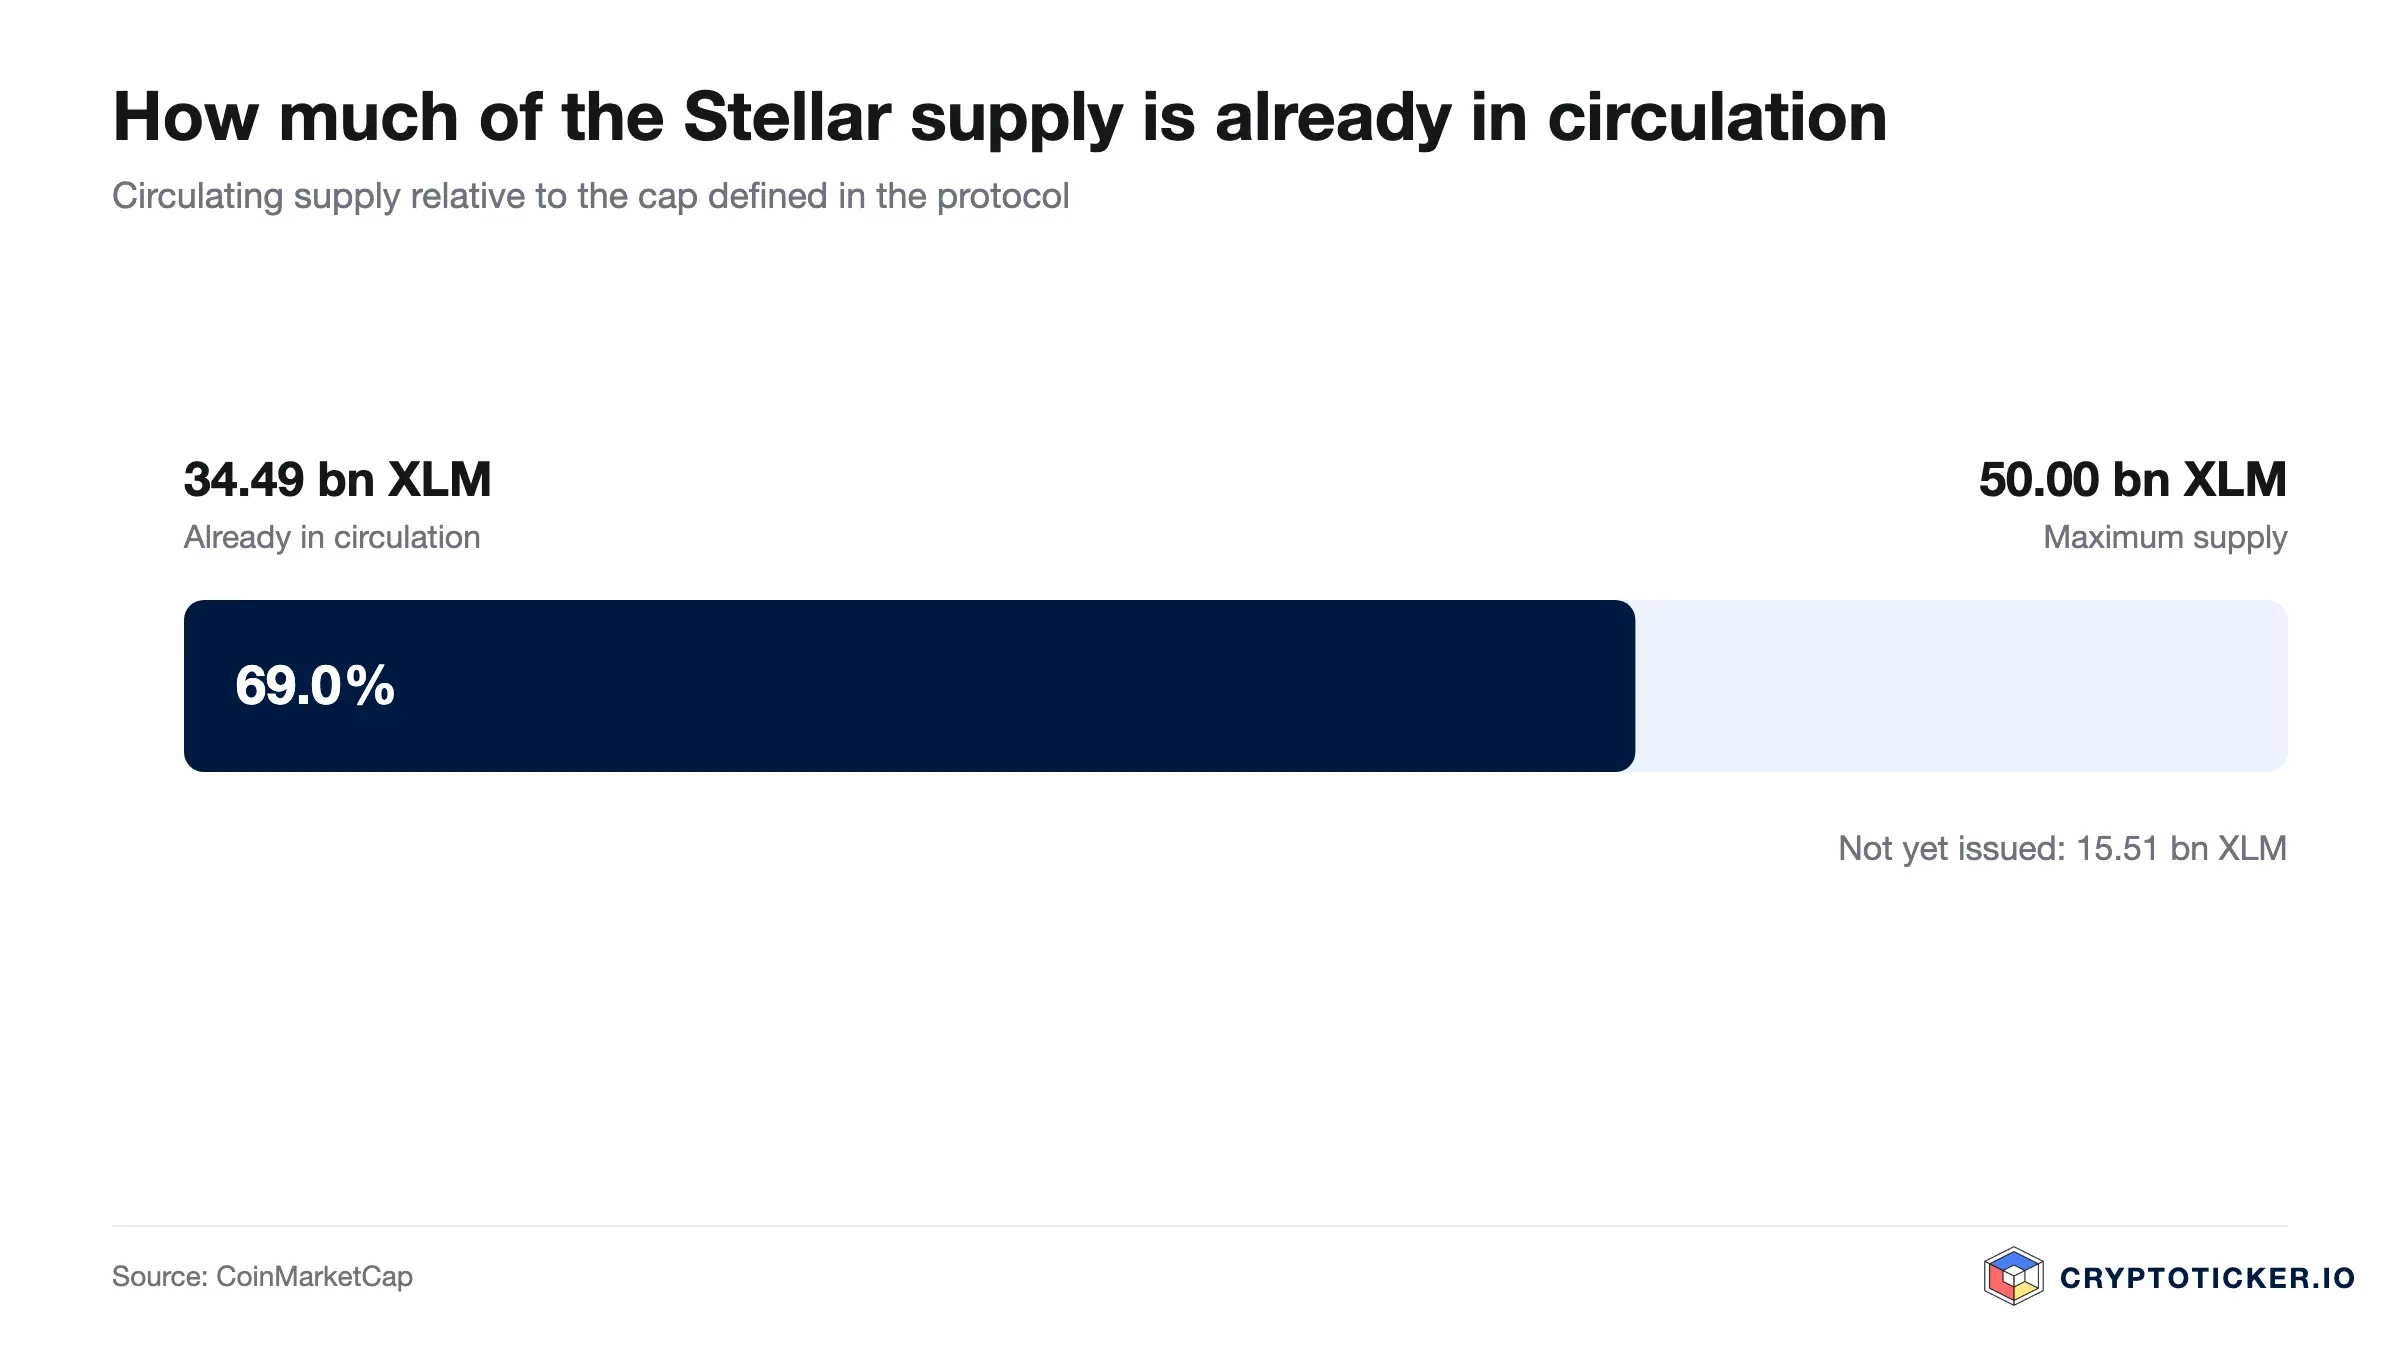
Stellar's supply is capped and largely issued. Of a maximum of 50.00 billion XLM, 35.01 billion are in circulation, which is 70.0 percent. The remaining 15.0 billion sit with the Stellar Development Foundation and are released according to published mandates. There is no ongoing inflation in the sense of newly mined units, and the foundation burned roughly half of the original supply in 2019. The details of the model are documented on the Stellar Lumens overview.
The network's purpose is payment settlement and asset issuance rather than general-purpose computation, with a stated focus on cross-border transfers and tokenised deposits. The documentation for issuers and anchors is published at developers.stellar.org. Whether that focus translates into sustained demand for the asset is a separate question from whether the network is used, and the two have diverged before.
On regulation, European rules now apply in full to service providers rather than to the asset. The European Securities and Markets Authority supervises the framework and publishes the register of authorised firms. For a buyer in the European Union the practical effect is that the venue matters as much as the coin, and the comparison of regulated exchanges tracks which providers hold which permissions.
What speaks for buying Stellar at current prices
Three arguments carry weight at 0.2285 US dollars.
- The trend structure has turned. The price has closed above the 200-day average of 0.1931 US dollars since 19 September and stands 15.5 percent above it, and the pullback on 11 September set a higher low at 0.1747 US dollars. Anyone buying now buys with that structure rather than against it.
- Volume confirms the move. Turnover of 855.0 million US dollars a day runs at roughly three times the 30-day average of 272.2 million, so the recovery is carried by participation rather than by an absence of sellers.
- Supply is capped and 70.0 percent issued, so the dilution risk that weighs on assets with open emission schedules is comparatively limited here. What remains is release from a known holder under published mandates rather than open-ended issuance.
What speaks against buying Stellar at current prices
Three arguments point the other way.
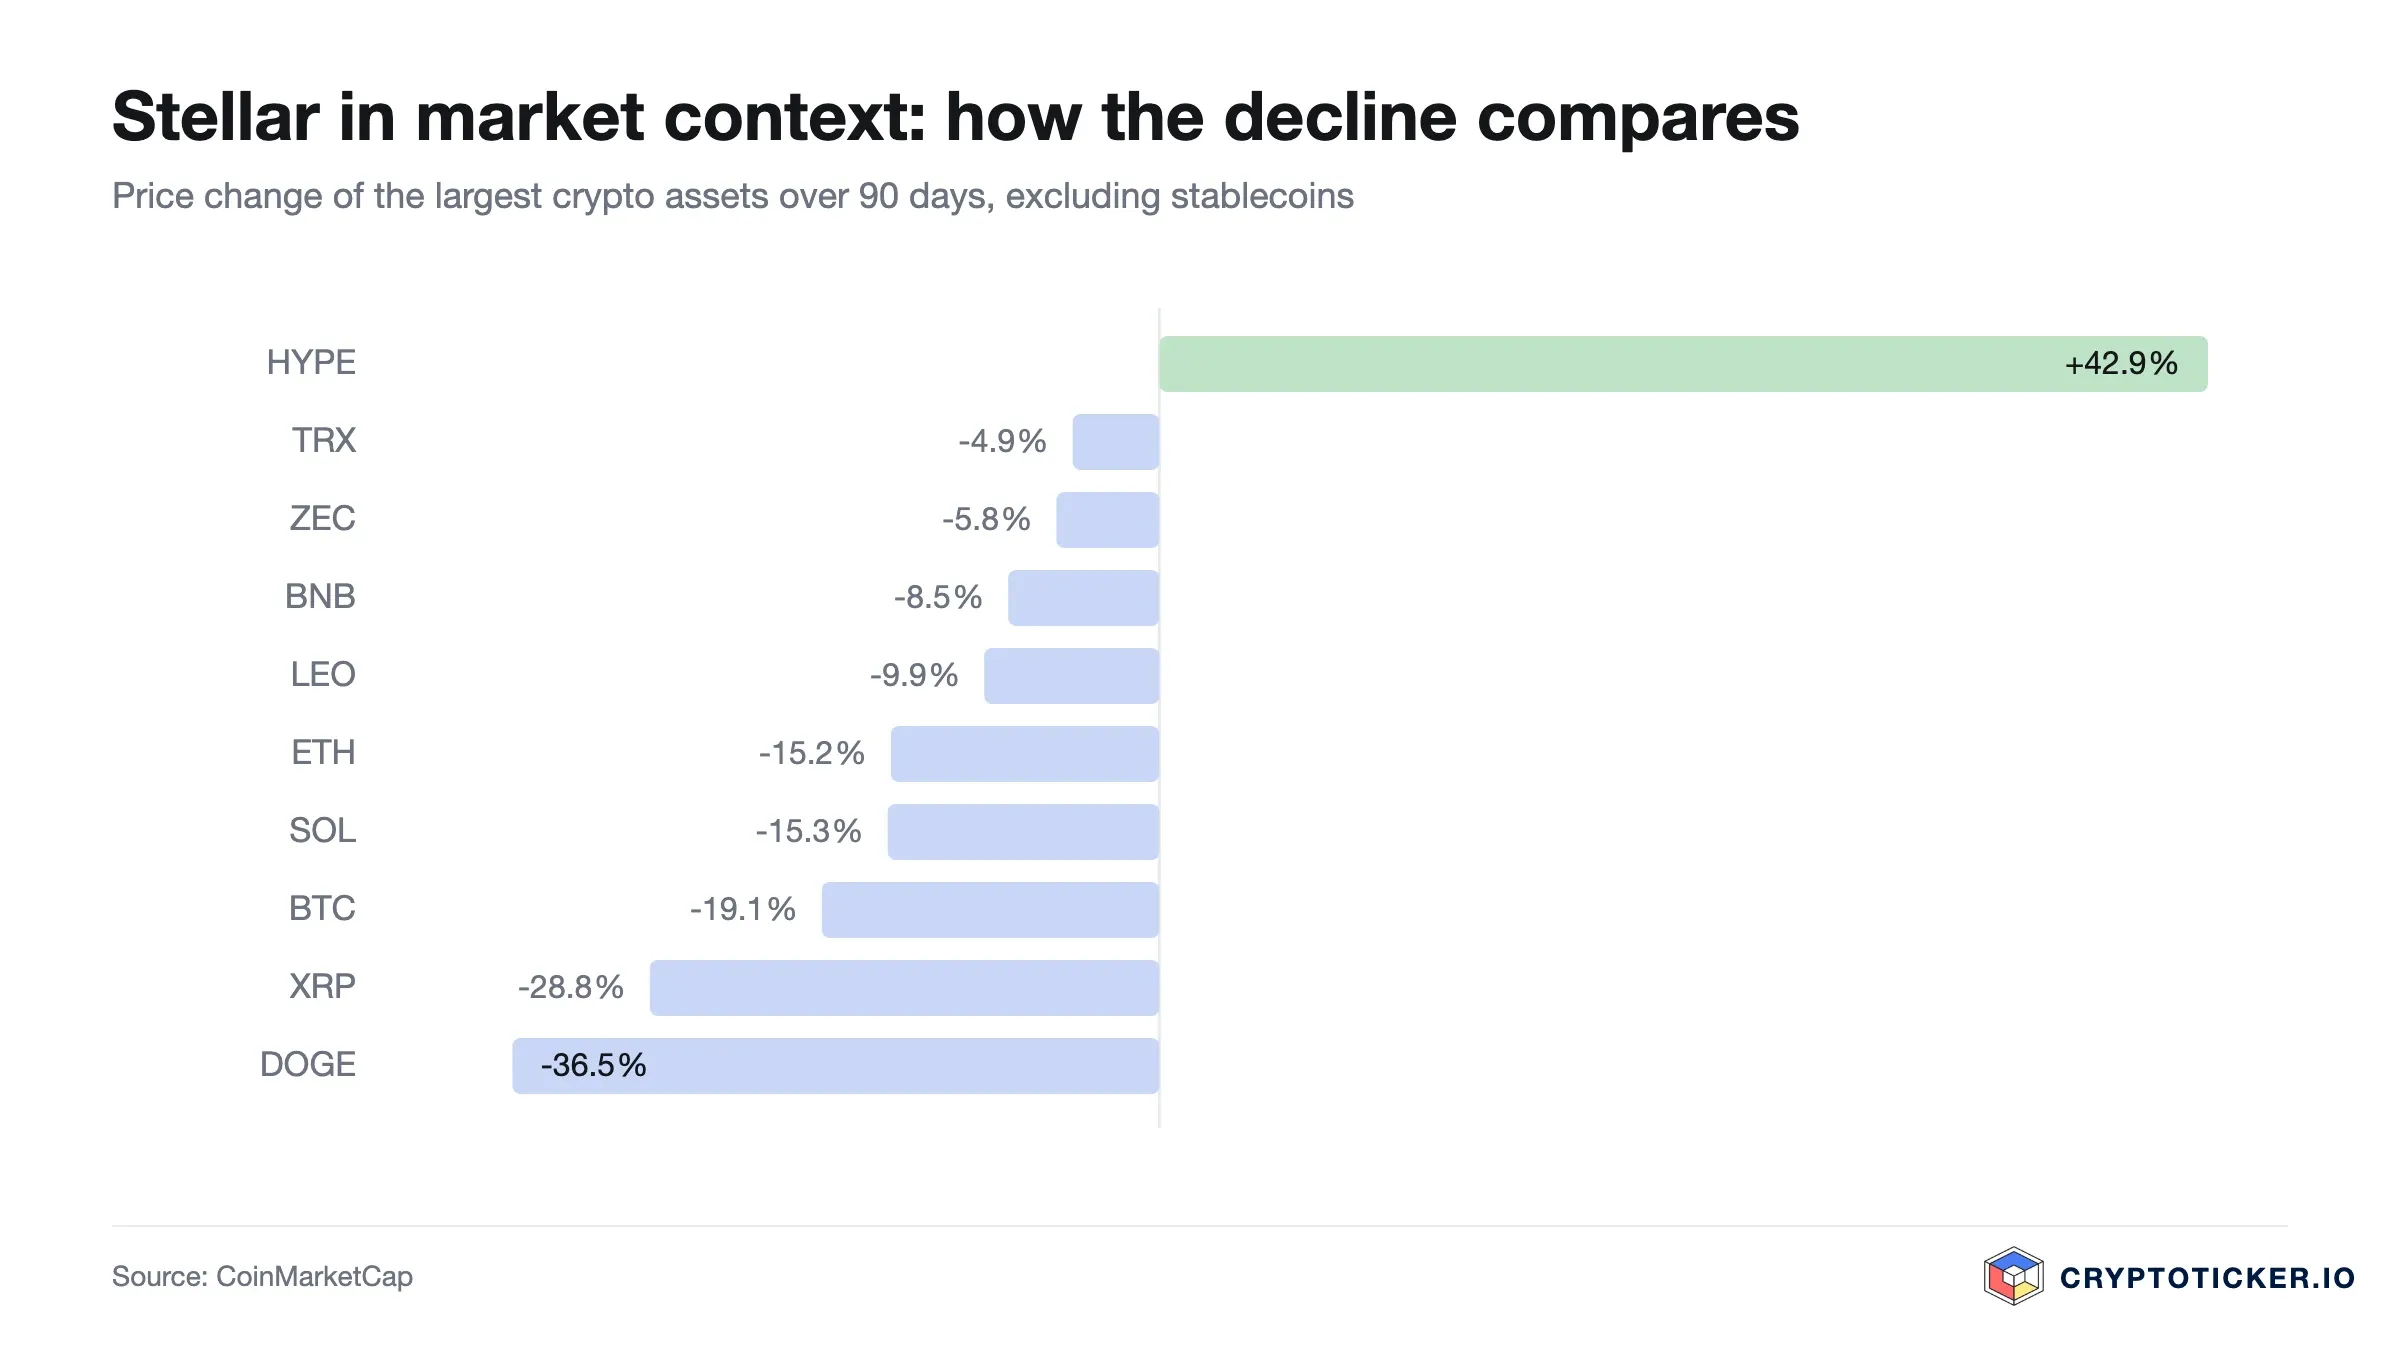
- The move has already happened. The price is up 30.9 percent over 30 days and the RSI stands at 65.8 points. The first genuine support below the current price sits at the two averages around 0.1930 US dollars, 15.5 percent away, and a pullback of that size would be entirely normal inside an uptrend.
- The confirmation is missing. The 50-day average at 0.1929 US dollars is still marginally below the 200-day average at 0.1931 US dollars, so the crossover that would seal the reversal has not occurred. Until it does, the move remains a strong counter-rally on the evidence available.
- The broader market has turned greedy. The CoinMarketCap Fear and Greed Index reads 69 points, in the greed range, and purchases made in greedy conditions have historically been more expensive than purchases made in fearful ones. Stellar sits at rank 16.

How to buy Stellar at current prices: costs, custody and providers
Three cost blocks decide what an entry actually costs. The trading fee is charged per order and typically ranges from about 0.1 percent on maker-taker models to well above one percent on simplified buy interfaces. The spread between bid and ask is not shown separately. The withdrawal fee applies when you move XLM off the exchange, while the on-chain cost on the Stellar network is a fraction of a cent.
The provider question separates two use cases. For a position you intend to trade, an exchange account with low per-order costs is usually adequate; our Kraken review covers one such venue. For a position you intend to hold, the relevant criteria are the provider's regulatory permissions and its withdrawal terms, which our Bitpanda review examines.
Custody is the second decision. Coins left on an exchange are a claim against that exchange rather than an asset you control, which is acceptable for a short holding period and less so for a long one. Moving XLM to your own wallet removes that counterparty risk and adds the obligation to secure a recovery phrase. Suitable devices are ranked in the hardware wallet comparison.
So is Stellar a good buy at current prices, short-term and long-term
Over a short horizon the evidence has swung in favour of the buyers. The RSI at 65.8 points, the price above both averages, and turnover at three times its 30-day average describe a market with momentum behind it. The price paid for that evidence is the entry level itself: after 30.9 percent in four weeks, a buyer is paying for the recovery rather than for the floor. The nearest resistance is the interim high at 0.2322 US dollars, 1.6 percent away, and the nearest support is the pair of averages around 0.1930 US dollars, 15.5 percent away. Risk and reward are asymmetric on those two levels, and not in the buyer's favour.
Over a horizon of several years the calculation rests on different inputs. A capped supply that is 70.0 percent issued, a network with a defined purpose, and a price 44.3 percent below its twelve-month high are the conditions under which long-term positions have historically been built in this asset class. None of that establishes that the recovery continues, and the 37.3 percent twelve-month decline is a reminder of how far the asset fell first.
The assumption of a reversal counts as disproved if the price closes below the two moving averages around 0.1930 US dollars on a daily basis, because the breakout since 19 September would then have been a counter-move. It counts as confirmed if the 50-day average crosses above the 200-day average and XLM closes above the interim high of 0.2322 US dollars on rising volume. These levels let you check your own assessment against the market rather than against an opinion.
Buying Stellar: what to take away
- The Stellar price of 0.2285 US dollars sits 15.5 percent above the 200-day average of 0.1931 US dollars, 15.6 percent above the 50-day average of 0.1929 US dollars, and 44.3 percent below the twelve-month high of 0.4100 US dollars. The trend has turned; the crossover that would confirm it has not happened yet, and the running assessment is in our Stellar price prediction.
- An RSI of 65.8 points and turnover at three times the 30-day average describe strength without overheating. Anyone entering should know what each purchase costs, and the exchange comparison shows where the differences lie.
- For a holding meant to sit for years, custody is the second decision alongside the entry price, and the choice of a regulated venue is the third. Both are covered in the hardware wallet comparison.
Disclosure: Some of the providers mentioned in this article work with us through partner programmes. This has no influence on the price analysis or on our assessment of the chart; the price data comes from a public market data source and can be verified there.
(As of 29 September 2026. This article is not investment advice. Prices, fees and terms change; check them with the provider before every purchase. Crypto assets are subject to high price volatility and a total loss is possible.)
Transparency note: This article was produced with the assistance of artificial intelligence and reviewed by our editorial team before publication. All figures and claims were checked against the primary sources linked in the text. The feature image was generated with AI.
Which topics should we dive deeper into?
Select what genuinely interests you. Your picks feed directly into our editorial planning.
Crypto news that's actually worth your time.
Weekly. 60 seconds. Carefully curated by our editors: no hype, no promo flood, no spam.
More from CryptoTicker