Ethereum Price Prediction – ETH On The Verge of a Massive Breakout
Ethereum seems to have established an ascending wedge pattern on the daily chart that is fairly close to the breakout point. The digital asset has tested the lower trendline several times in the past. The support level at $376 coincides […]

Ethereum seems to have established an ascending wedge pattern on the daily chart that is fairly close to the breakout point. The digital asset has tested the lower trendline several times in the past. The support level at $376 coincides with the 50-SMA and the 100-SMA, making it stronger.
In the past month, ETH grew from a market capitalization of $38 billion on October 8 to a high of $47.2 billion on October 23. Ethereum is under a period of consolidation awaiting a clear breakout.
Join our trading group on Telegram for daily updates and trading advice
Ethereum Price Analysis: Technical Indicators
As stated above, the ascending wedge formed on the daily chart is the most important pattern currently. The breakout above or below the trendlines of this pattern will have a significant impact on the price of Ethereum.
ETH/USD daily chart – TradingView
The current support level is established at $376 and resistance at $420. The MACD has just turned bearish for the first time since September 28 and seems to be gaining strength. Losing the massive support area at $376 could be devastating for ETH pushing it to the low of $313.
On the other hand, a breakout above the resistance level at $420 can easily drive the price of ETH towards $500.
ETH/USD 4-hour chart – TradingView
The 4-hour chart shows Ethereum losing the 50-SMA and the 100-SMA but bouncing back up from the 200-SMA. The MACD also turned bearish here but it’s close to a bull cross. The RSI is also on the verge of crossing to oversold levels which should increase buying pressure.
Short-term resistance can be found at $388 and $401 before the upper trendline at $420.
Ethereum On-Chain Analysis
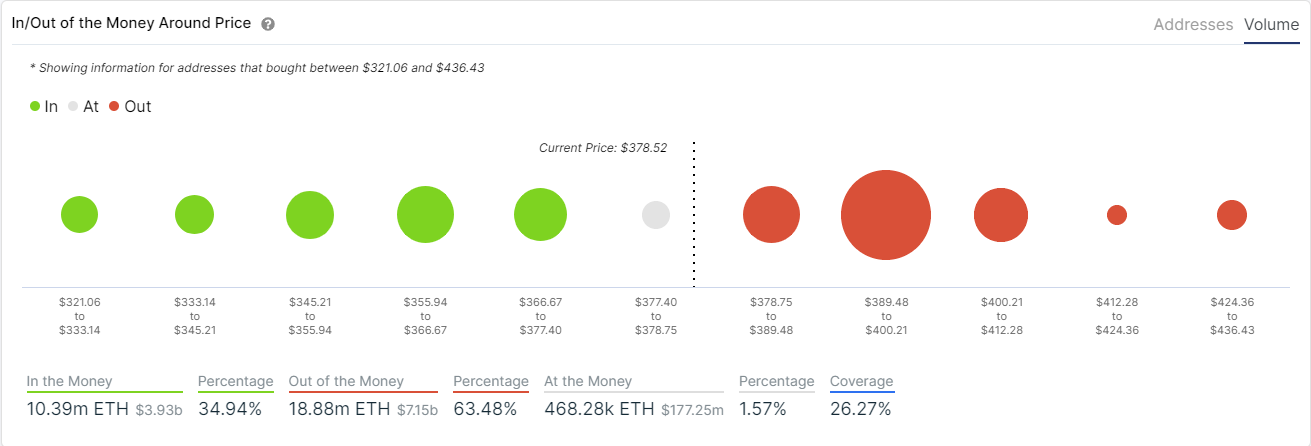
The IOMAP chart shows a robust resistance level between $389 and $400, which means a lot of investors bought a lot of coins around that price range. However, besides that point, which coincides with the resistance at $401 we talked about before, there seems to be very little opposition.

On the other side, support is far lower in comparison and there isn’t any relevant support area to talk about.

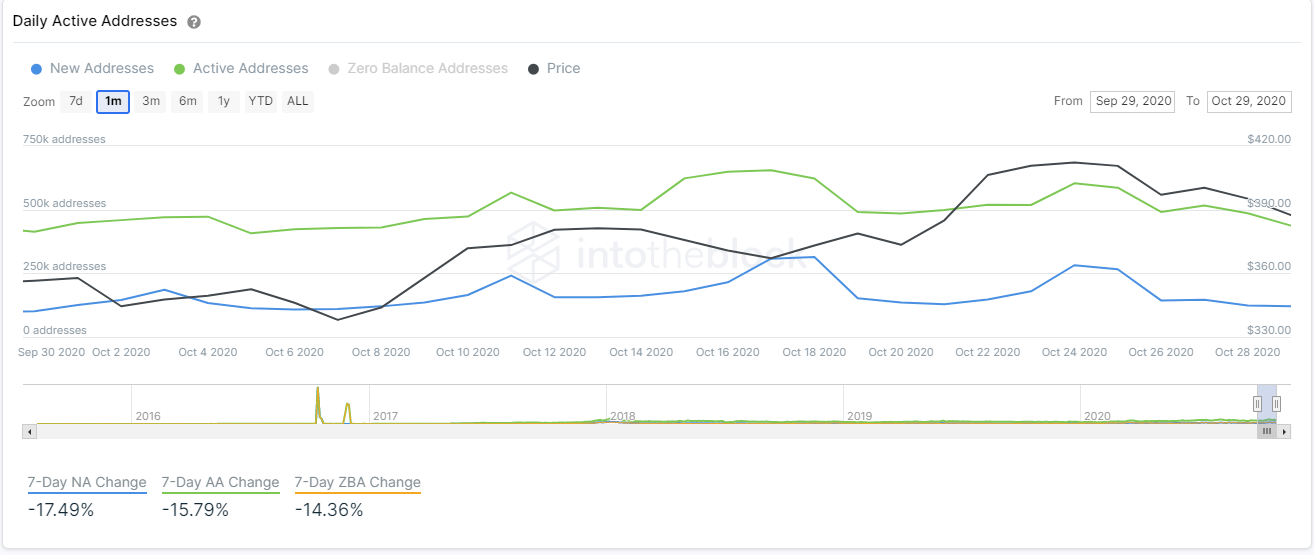
Ethereum is experiencing a massive decrease in the number of new addresses joining the network as well as active addresses. In the past 7 days, both metrics are down by more than 15% and show no signs of recovery so far.
Considering that Ethereum’s price is under consolidation, this lack of activity by old users and new users shows little interest in the digital asset. This means that new and old investors are not that interested in buying ETH despite the price being ‘cheaper’.


