Ethereum Price Cracks $330 With a Ton of Trading Volume
Ethereum just blasted through $330 hitting a price of $333 on Binance and slightly dropping to $328. Bitcoin price also hit $11,400 leading the way this time as Ethereum was the first top coin to see a breakout. Ethereum price […]

Ethereum just blasted through $330 hitting a price of $333 on Binance and slightly dropping to $328. Bitcoin price also hit $11,400 leading the way this time as Ethereum was the first top coin to see a breakout.
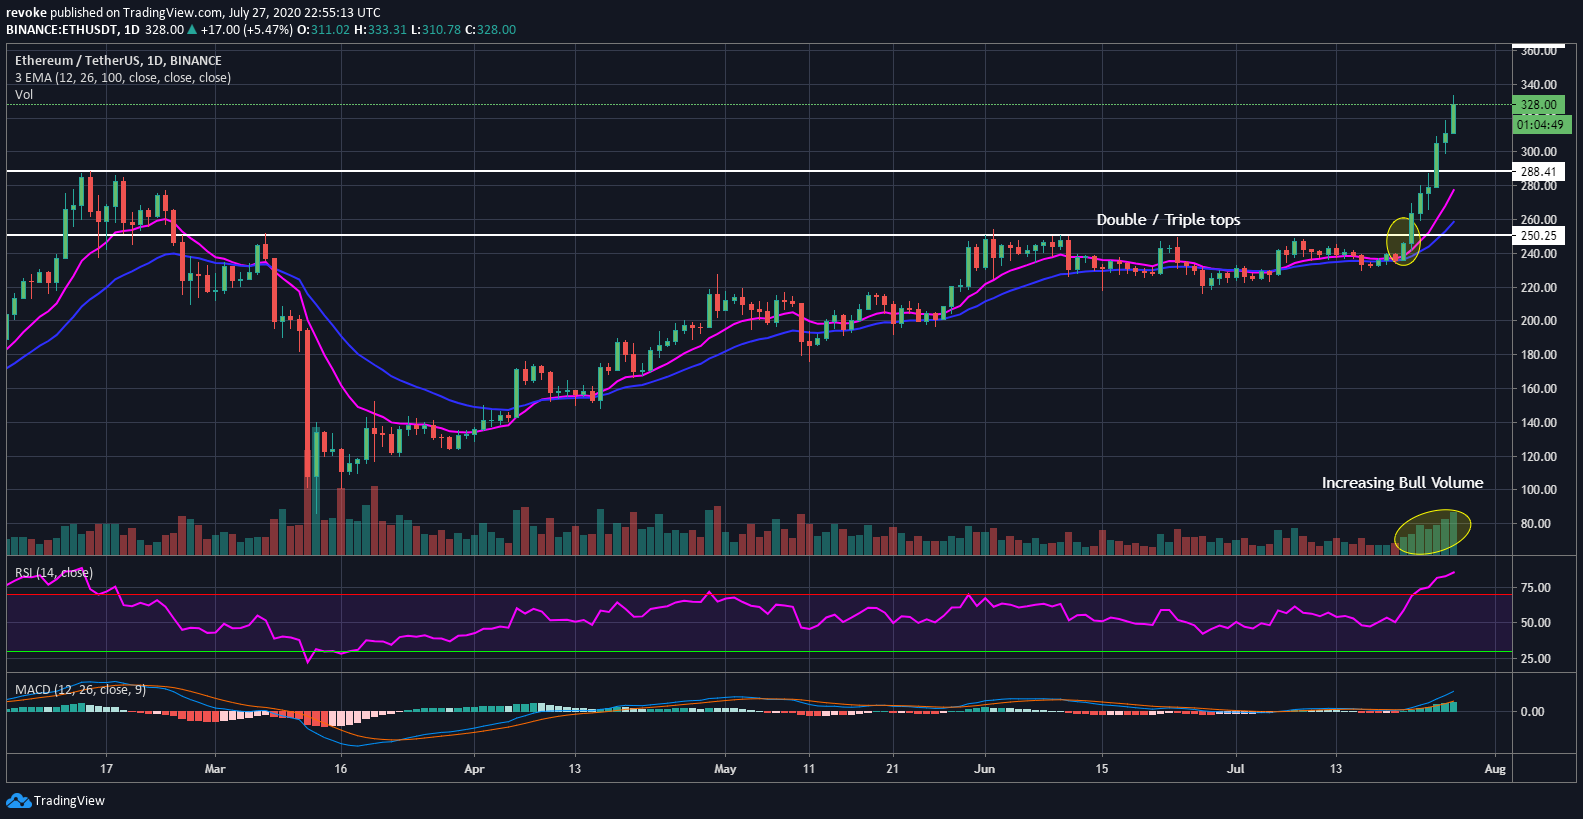
Ethereum price is now up 41% in just 6 days and is not stopping any time soon judging by many indicators.
Ethereum Price, Daily Chart

One of the most important things to consider is the significant increase in trading volume. Looking at past attempts by Ethereum to crack $250, we can observe that the trading volume was not high enough.
Currently, Ethereum’s volume is not only high but is still increasing even after 6 days of straight profit. The RSI is clearly overextended but won’t pose any threat to the bulls in the short-term as momentum is strong and FOMO is definitely playing a factor here.
The DeFi craze that pushed many altcoins to all-time highs is now switching towards Ethereum and Bitcoin. The clear breakout above $250 is a crucial long-term resistance level and has been destroyed by the buyers.
The 2020-high was also broken at $289 and Ethereum is now targeting the 2019-high at $366.
Ethereum Price, Weekly Chart
Ethereum is now in a clear weekly uptrend and only facing the $366 resistance level. The RSI is overextended and could mean Ethereum is getting ready for a pullback. Last time the RSI got to this level, Ethereum experienced a massive drop below $100, however, the FOMO now is far stronger than it was last time.
The MACD has remained bullish for the last 4 months and the volume will most likely be higher than last week if bulls can keep up with the pace.


