Binance Coin Price Analysis: Can BNB Price touch $40?
Binance Coin price seems to be flouting the complete cryptocurrency market as it is one of the coins that has slightly recovered in the last 30 days from the most recent crash while big coins like Bitcoin and Ethereum were struggling. […]


Binance Coin price seems to be flouting the complete cryptocurrency market as it is one of the coins that has slightly recovered in the last 30 days from the most recent crash while big coins like Bitcoin and Ethereum were struggling. At the time of writing this, the Binance coin price is sitting at $27.71 and it has increased by almost +17.80% in the last 30 days. Can BNB price touch $40 in the coming days? Let’s take a look at it in more detail.
Binance Coin Price Analysis: BNB Price Daily Chart
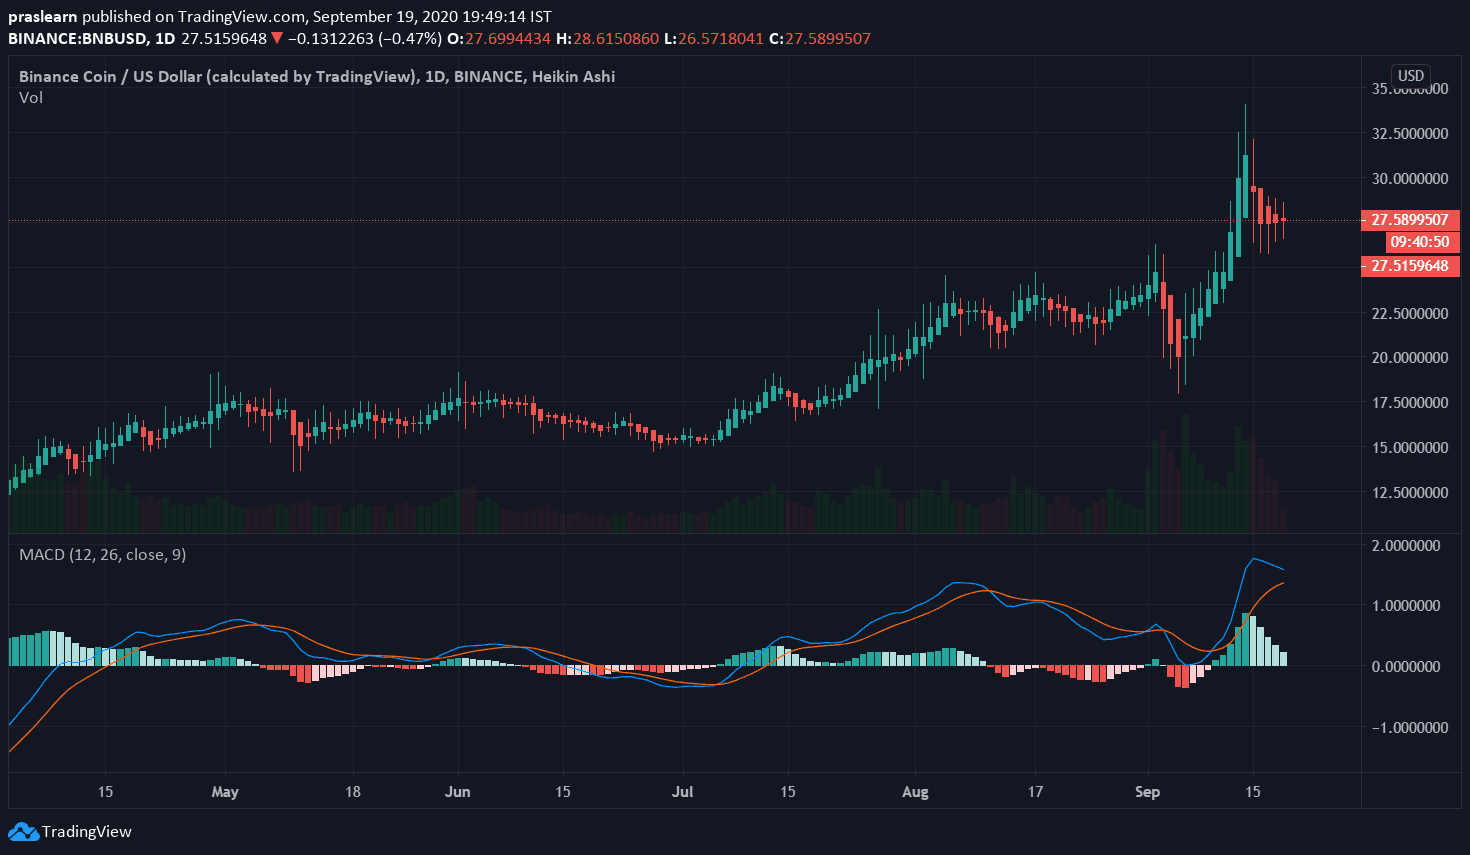
If we closely observe the daily chart then we will find that the Binance coin price has slightly managed to gain after jumping from an overextended RSI and rising above the 50-MA, the 100-MA, and the 200-MA. The next most important resistance level could be $28.97 which is the 2020-high. The BNB price has encountered a striking increase in trading volume over the past week and the daily MACD is slightly bullish again. The key metrics are as follows:
- Price $27.66
- 24hr Change -0.59%
- 24hr Vol $132,159,721
- Liquid Marketcap $2,966,598,151
- Liquid Supply 108,345,641
Binance Coin Price Analysis: BNB Coin Price 4-hour Chart Could be Crucial
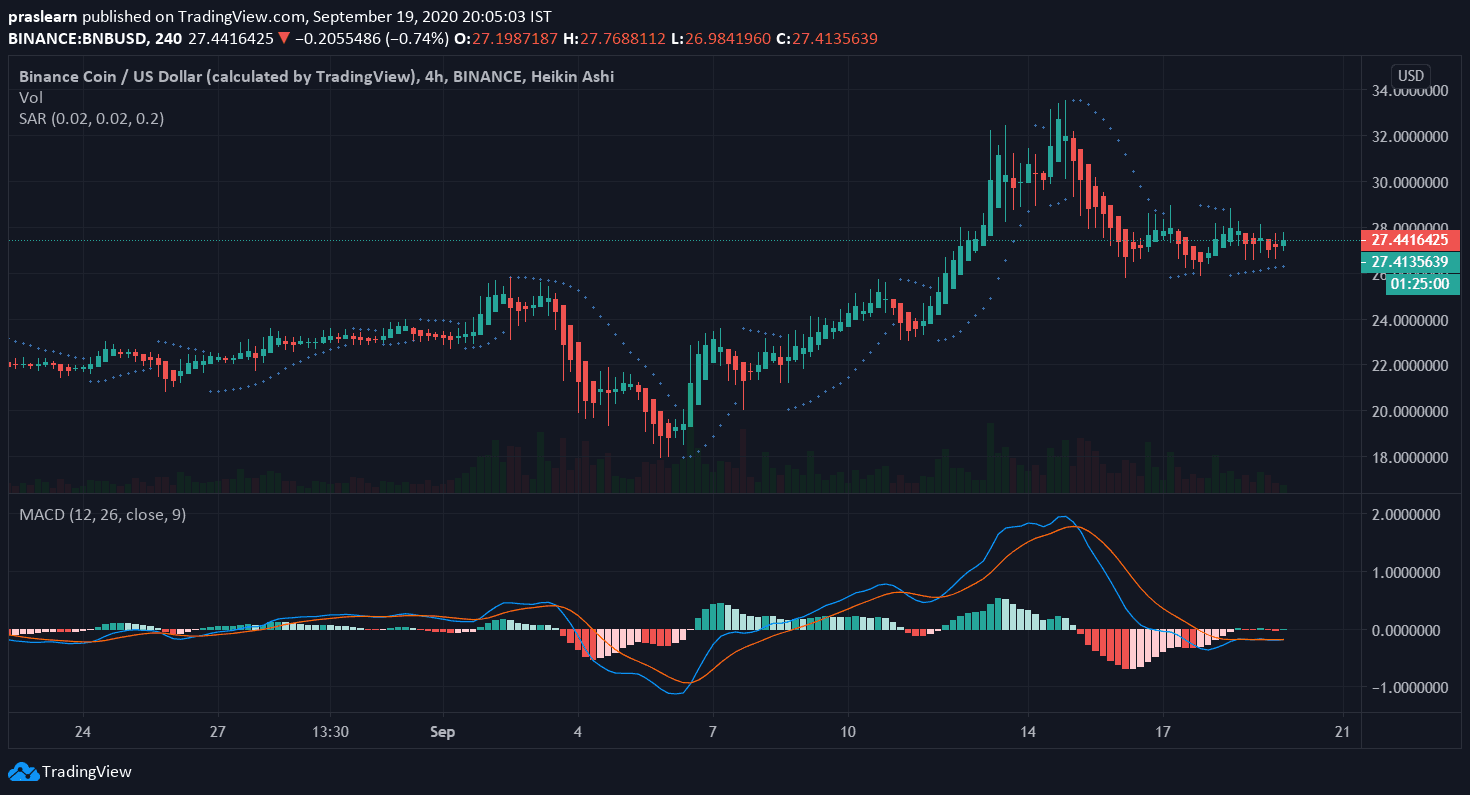
Now, if we closely observe the BNB/USD 4 hr Parabolic SAR chart then we will find that it is showing a slight upwardly sloping pattern. We can see that some dots have formed below the price and are climbing in an upwardly sloping pattern, this could suggest an uptrend for Binance coin price.
We must remember that the dots that rise above price and are slumping in a declined sloping pattern then it could be a downtrend. So, at the moment, the BNB price is showing an uptrend. As mentioned earlier, the most important resistance for BNB price could be $28.97 and if Binance coin manages to crack this then it could soon touch the $35 mark and then $40.
Binance Coin Price Analysis: BNB Price Long-Term Overview
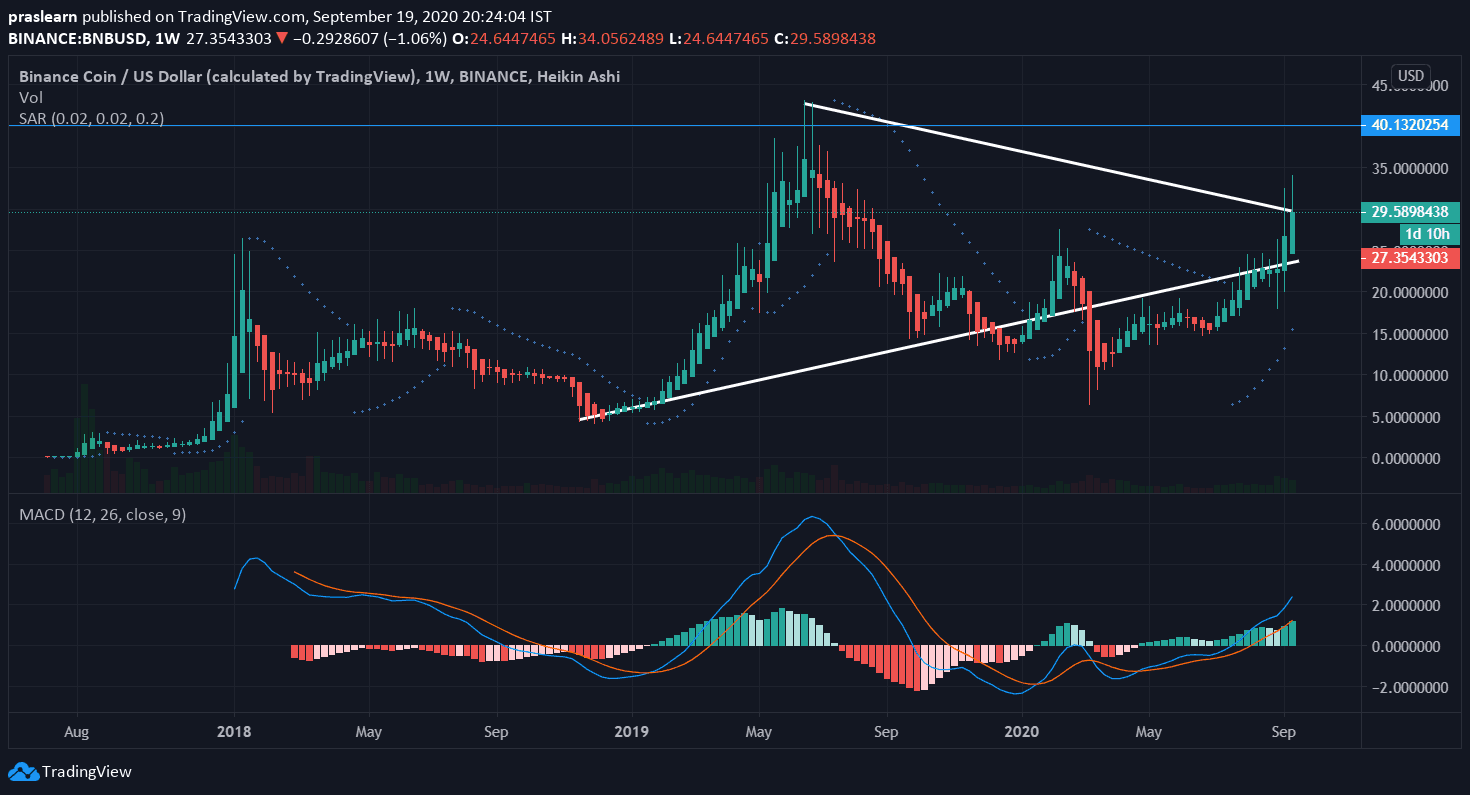
Now, Binance coin is by far one of the best accomplishing digital assets in the past two years. The weekly chart is highly in support of the bulls right now and there is a large symmetrical triangle formed since November 2018. This is the pattern that indicates BNB could first touch $35 soon and then finally touch the $40 mark.
Now, if we observe the weekly Parabolic SAR, then we will find that the dots have formed between $6 to $15 price range and as per the Parabolic SAR, the rate of change often described its sensitivity, can be adjusted by reducing the step. This operates by extending the gap between SAR and price.
Now, the thing with the SAR is that it could reverse once the price reaches its level. Hence, if SAR is further from price, withdrawal in the indicator is less expected. So, right now, the SAR is too far from the current Binance coin price, which could indicate that the BNB/USD price could increase in the next few days. As mentioned earlier, the RSI was overextended and it seems that it has now slightly cooled off so this could be a positive sign for the BNB price. We wish you happy trading!
Follow CryptoTicker on Twitter and Telegram for daily crypto news and price analysis