Crypto Forecasting: Mastering Leading and Lagging Signals
In the world of financial markets, two terms often pop up: leading and lagging indicators. Let's take a look at this Crypto forecasting.

In the world of financial markets and trading, two terms often pop up: leading and lagging indicators. These indicators are essential tools for traders and investors, helping them predict future price movements and make informed decisions. In the realm of cryptocurrencies, which is known for its volatility, understanding these indicators becomes even more crucial. Let’s delve into what these indicators are, their differences, and how they apply to the cryptocurrency market. Let’s take a look at this Crypto forecasting article in more detail.
Leading Indicators: These are predictive indicators that aim to forecast future price movements. They give signals before a new trend or reversal occurs. Leading indicators are best used in ranging markets (when prices move sideways) and are often used to identify potential breakout or breakdown points.
Lagging Indicators: These indicators provide signals after the trend has started. They are best used to confirm a trend and are more reliable than leading indicators because they are based on historical data. However, they might not be as useful for predicting future movements since they react to price changes that have already occurred.
Crypto Forecasting: Examples of Leading Indicators in Cryptocurrencies:
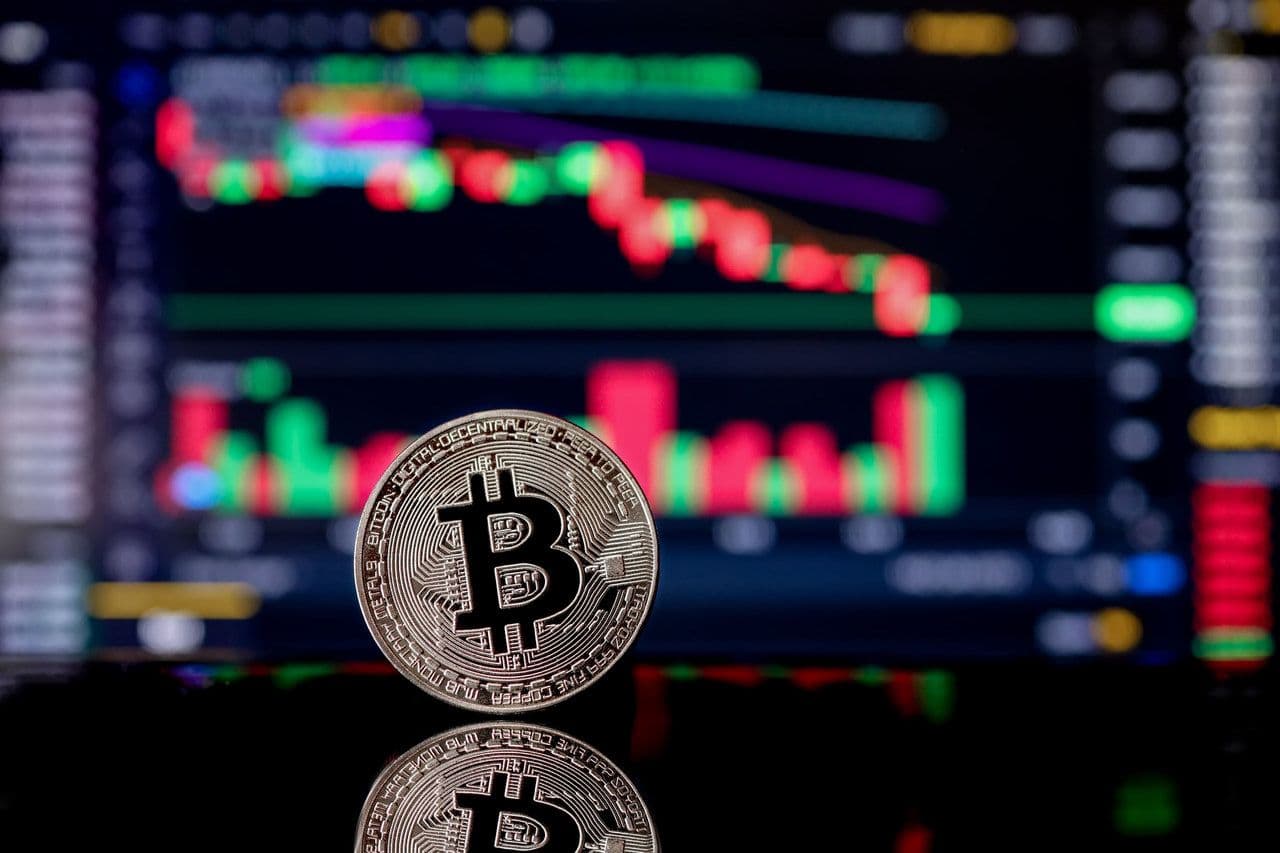
- Relative Strength Index (RSI): The RSI measures the speed and change of price movements and ranges between 0 to 100. Typically, an RSI above 70 indicates that a cryptocurrency is overbought and might be due for a price correction, while an RSI below 30 suggests that it’s oversold and might experience a price increase.
- Example: If Bitcoin‘s RSI crosses above 70, a trader might anticipate a price drop soon and might consider selling.
- Stochastic Oscillator: This indicator compares a cryptocurrency’s closing price to its price range over a specific period. Like the RSI, it ranges between 0 to 100 and uses the 20 and 80 levels as potential overbought and oversold thresholds.
- Example: If Ethereum‘s stochastic oscillator moves below 20, it might be a signal that Ethereum is oversold and could be due for a bullish reversal.
Crypto Forecasting: Examples of Lagging Indicators in Cryptocurrencies:
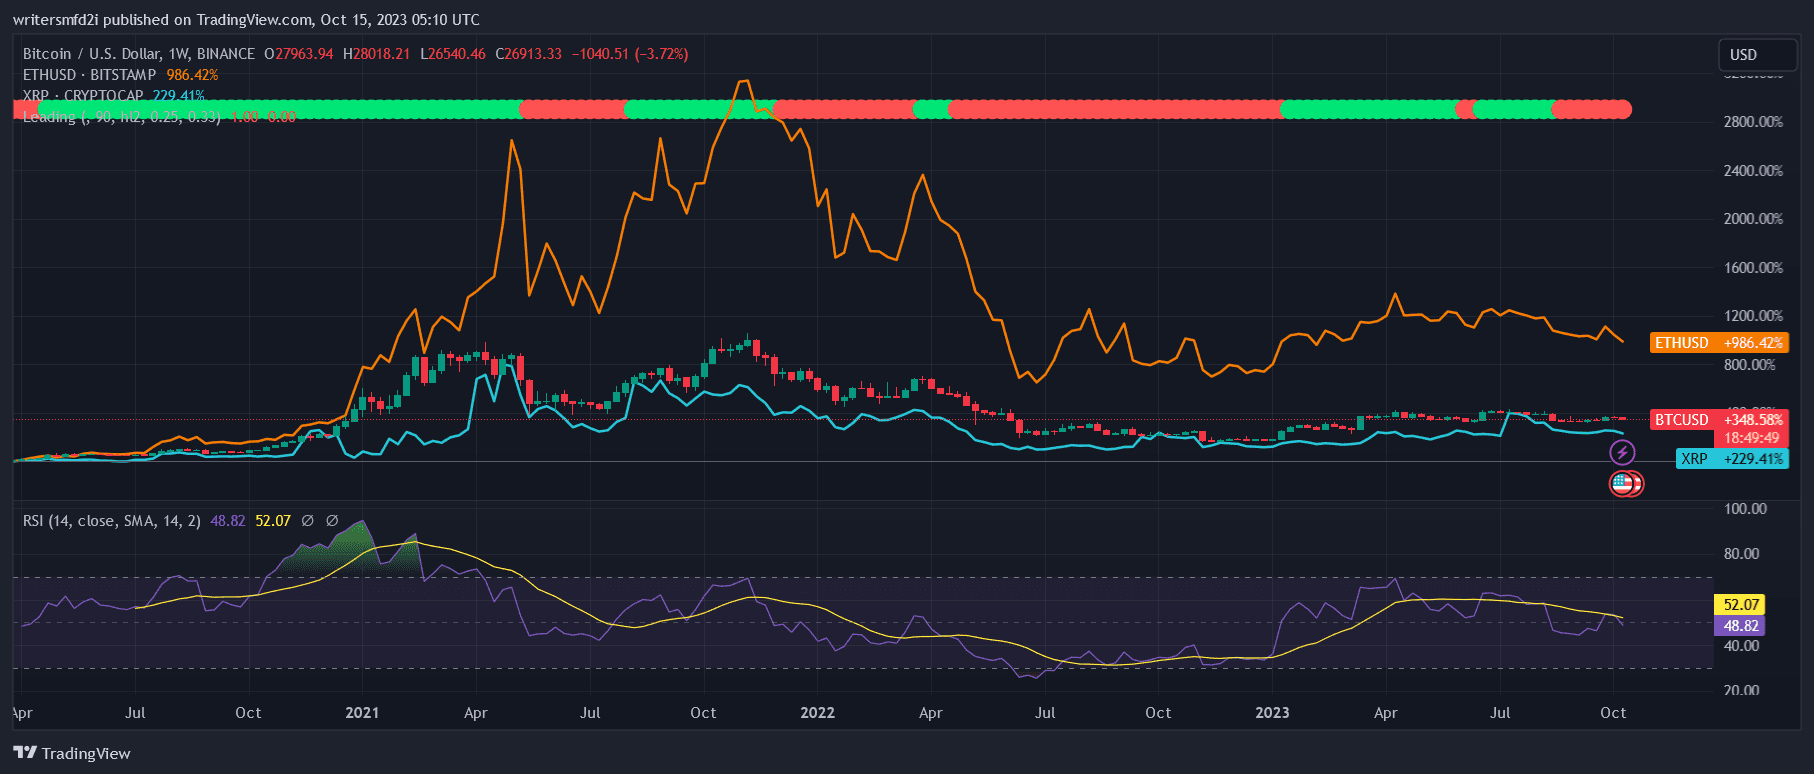
- Moving Averages (MA): One of the most popular lagging indicators, MAs smooth out price data to create a single flowing line, which makes it easier to identify the direction of the trend. The two most common types are the Simple Moving Average (SMA) and the Exponential Moving Average (EMA).
- Example: If the 50-day SMA of Litecoin crosses above its 200-day SMA, it’s known as a “golden cross” and can be a bullish signal.
- Bollinger Bands: This indicator consists of an SMA (middle band) with two outer bands. The outer bands are standard deviations away from the middle band. When the bands tighten, it indicates decreased volatility, and when they widen, it indicates increased volatility.
- Example: If Ripple‘s price touches the upper Bollinger Band, it might indicate that it’s overbought. Conversely, if it touches the lower band, it might be oversold.
Why are these Indicators Important in Crypto Forecasting?
Cryptocurrencies are known for their high volatility. Prices can skyrocket, but they can also plummet. Leading and lagging indicators provide traders with tools to potentially predict these price movements and make informed decisions.
For instance, during the 2017 Bitcoin bull run, many traders used RSI and moving averages to time their entries and exits, maximizing their profits. Similarly, during market corrections, these indicators can provide insights into potential recovery points.
Conclusion
While leading and lagging indicators are valuable tools, it’s essential to remember that no indicator is foolproof. They should be used in conjunction with other tools and analysis methods, such as fundamental analysis, to increase the chances of successful trading. As with all investments, it’s crucial to do thorough research and understand the risks involved.