Bitcoin Stays Above $11,000 But There is a CME Gap at $9,600, Are Gaps Reliable?
Bitcoin price continues trading above $11,000, currently at around $11,263, and has created a clear bull flag on the daily chart. The breakout is now considered strong and definitely not a fakeout. The trading volume is now declining but it’s […]

Bitcoin price continues trading above $11,000, currently at around $11,263, and has created a clear bull flag on the daily chart. The breakout is now considered strong and definitely not a fakeout. The trading volume is now declining but it’s still higher than in the last month.
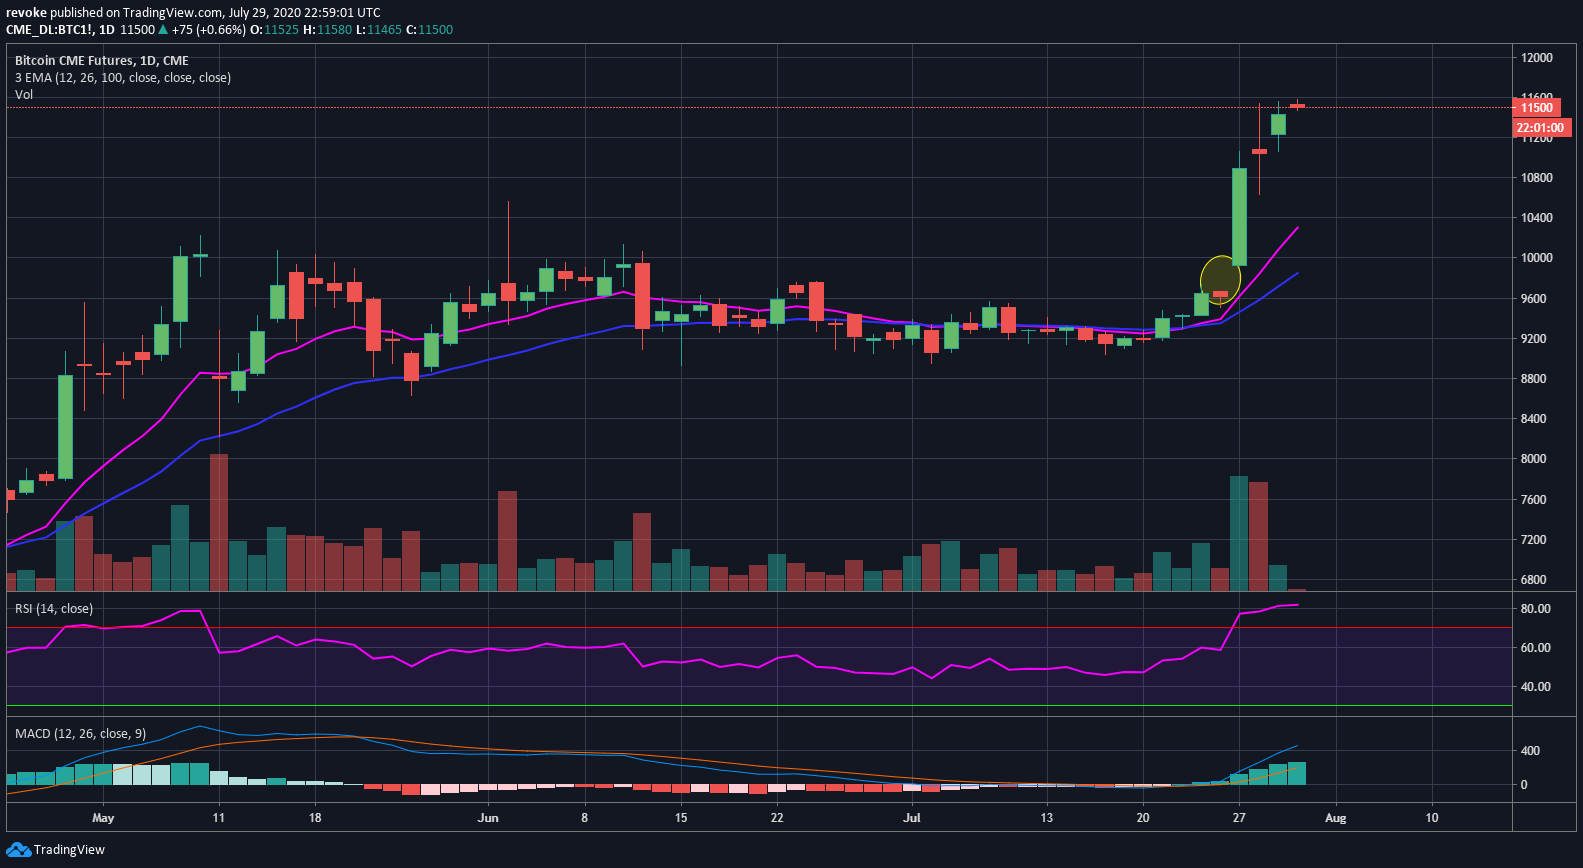
The most important resistance level in the short-term is $11,379, the last high and $12,300. The daily RSI is still overextended but should be ignored as FOMO is simply too high right now.
Unfortunately for Bitcoin, it seems that its latest rally caused a massive CME futures gap at $9,600 up to $9,900.

A gap is basically defined as the empty space between the close and open price of an asset. Bitcoin doesn’t have these gaps because the market is open 24/7, however, futures trading does close and open.
How Reliable Are Price-Gaps?
According to many technical analysts, a price-gap is a trading pattern because the price tends to ‘fill’ the gap eventually. Major gaps will usually occur after massive breakouts and they are supposed to be the most important ones.
It seems counter-intuitive to think Bitcoin will visit $9,600 again after such a massive breakout. After all, Bitcoin is now obviously bullish and has formed uptrends on many time frames.
Theory says that in volatile markets, traders can benefit from these large price gaps but is that really true? What makes a gap actually have to close?
If we look back at previous gaps, it does seem like Bitcoin always comes back to the gap and fills it but is that really what’s going on?
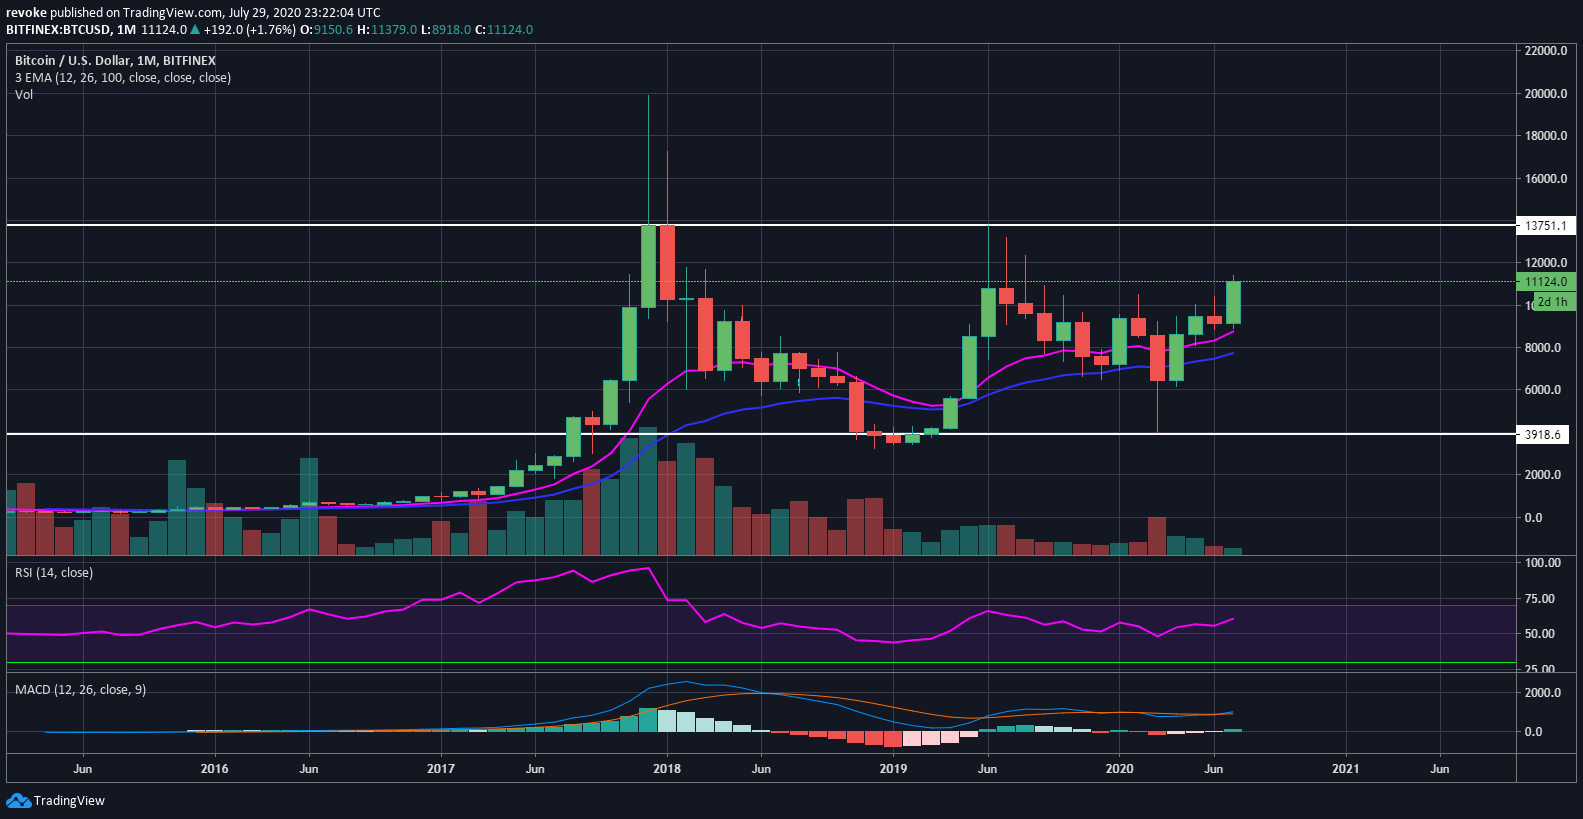
Bitcoin has been trading between $3,000 and $14,000 for the past two years. One could say that BTC was trading ‘sideways’ in the long-term so obviously it’s not hard to imagine the price visiting and re-visiting the same price levels over and over again.
The idea behind a gap is that it was originated because of irrational FOMO or fear, however, in this case, the breakout above $10,000 shouldn’t be considered irrational. Everyone knew $10K was a key level for Bitcoin to beat and it’s not a surprise that it managed to reach $11K this fast.
Looking at the gaps closely, we can observe that some gaps were actually left behind in 2019, although they were significantly smaller.
What’s Next For Bitcoin?
The daily chart is heavily bullish, the weekly chart is also quite bullish with a confirmed uptrend and a breakout of the bull flag. There are no significant resistance levels until $12,300 but the RSI is on the verge of overextension.

The most important time frame now is the monthly chart which is not yet in an uptrend. Bulls would need to break $14,000 in one go or set a higher low compared to $3,782 and then a higher high to confirm the uptrend. Either way, Bitcoin is above the monthly EMAs and is seeing a bullish cross of the MACD.


