Bitcoin Price Surpasses $12,700 As PayPal Announces Crypto Payments
Bitcoin is currently trading at $12,750 after huge news from PayPal supporting payments through cryptocurrencies starting in early 2021. Bitcoin was already in a significant bull rally, however, PayPal announced that customers will be able to use cryptos to access […]

Bitcoin is currently trading at $12,750 after huge news from PayPal supporting payments through cryptocurrencies starting in early 2021. Bitcoin was already in a significant bull rally, however, PayPal announced that customers will be able to use cryptos to access more than 26 million merchants around the world was the last spark.
Additionally, customers will also be able to purchase BTC, BCH, LTC, and ETH through PayPal directly. The price of BTC is up by more than 10% today and faces very little resistance to the upside according to most on-chain and off-chain metrics.
One of the most important timeframes for Bitcoin is the weekly chart. The last time BTC closed above $12,000 on this chart was back in January 2018. A close above $12k this week, which definitely seems likely, will easily push BTC up to the 2019-high at $13,970 and potentially above this level as well.
Bitcoin faces no real resistance until its all-time high
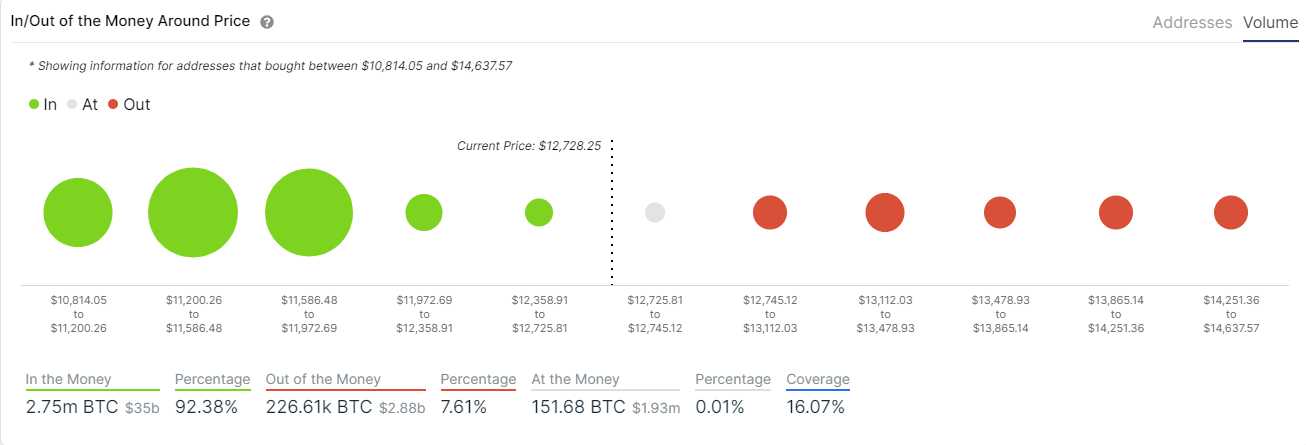
One of the most important on-chain metrics, the IOMAP chart, shows that Bitcoin price is barely facing any resistance towards $14,000.

On the daily chart, the current candlestick has pierced through several old resistance levels even though the RSI is heavily overextended. Fortunately for the bulls, the huge announcement from PayPal will most likely continue pushing the price of BTC ignoring the RSI and other potentially bearish indicators in the short-term.
BTC/USD daily chart – TradingView
Additionally, the MACD is bullish and gaining strength. Likewise, the SMAs are far below the current price and trading volume continues increasing every day for the past week. The bull move was strong enough to push the entire market this time, not just Bitcoin.
The total market capitalization jumped by $20 billion in the past 18 hours and it’s close to reaching the high of 2020 at $386 billion total.
Bitcoin Price Analysis: Long-Term
As mentioned above, the weekly chart is of vital importance for the bulls who are looking for a close above $12,000 end of the week. Buyers are eying up $13,000 in the short-term and even $14,000 by the end of the week if bullish momentum continues.
BTC/USD weekly chart – TradingView
There are very few bearish indicators right now. The weekly RSI is on the verge of being overbought, however, as we also mentioned, this will not likely pose a threat for the bulls in the short-term.
The 50-SMA and 100-SMA remain as support levels and the MACD turned bullish again gaining a lot of strength with the past Bitcoin move. The trading volume of this week also seems poised to surpass the past four weeks.


