Price forecast – Top 5 Altcoins – Is the market falling now?
This is the price analysis of the five largest altcoins, by market capitalization. Ethereum, Bitcoin SV and Tether were excluded from the analysis. Each cryptocurrency forms its own price pattern, but most altcoins correlate very strongly with Bitcoin. Therefore, it is important to […]


This is the price analysis of the five largest altcoins, by market capitalization. Ethereum, Bitcoin SV and Tether were excluded from the analysis. Each cryptocurrency forms its own price pattern, but most altcoins correlate very strongly with Bitcoin. Therefore, it is important to always keep an eye on Bitcoin first. Let’s take a look at top 5 altcoins.
The Bitcoin Price Analysis can be found here.
Top 5 Altcoins: Ripple (XRP) price forecast
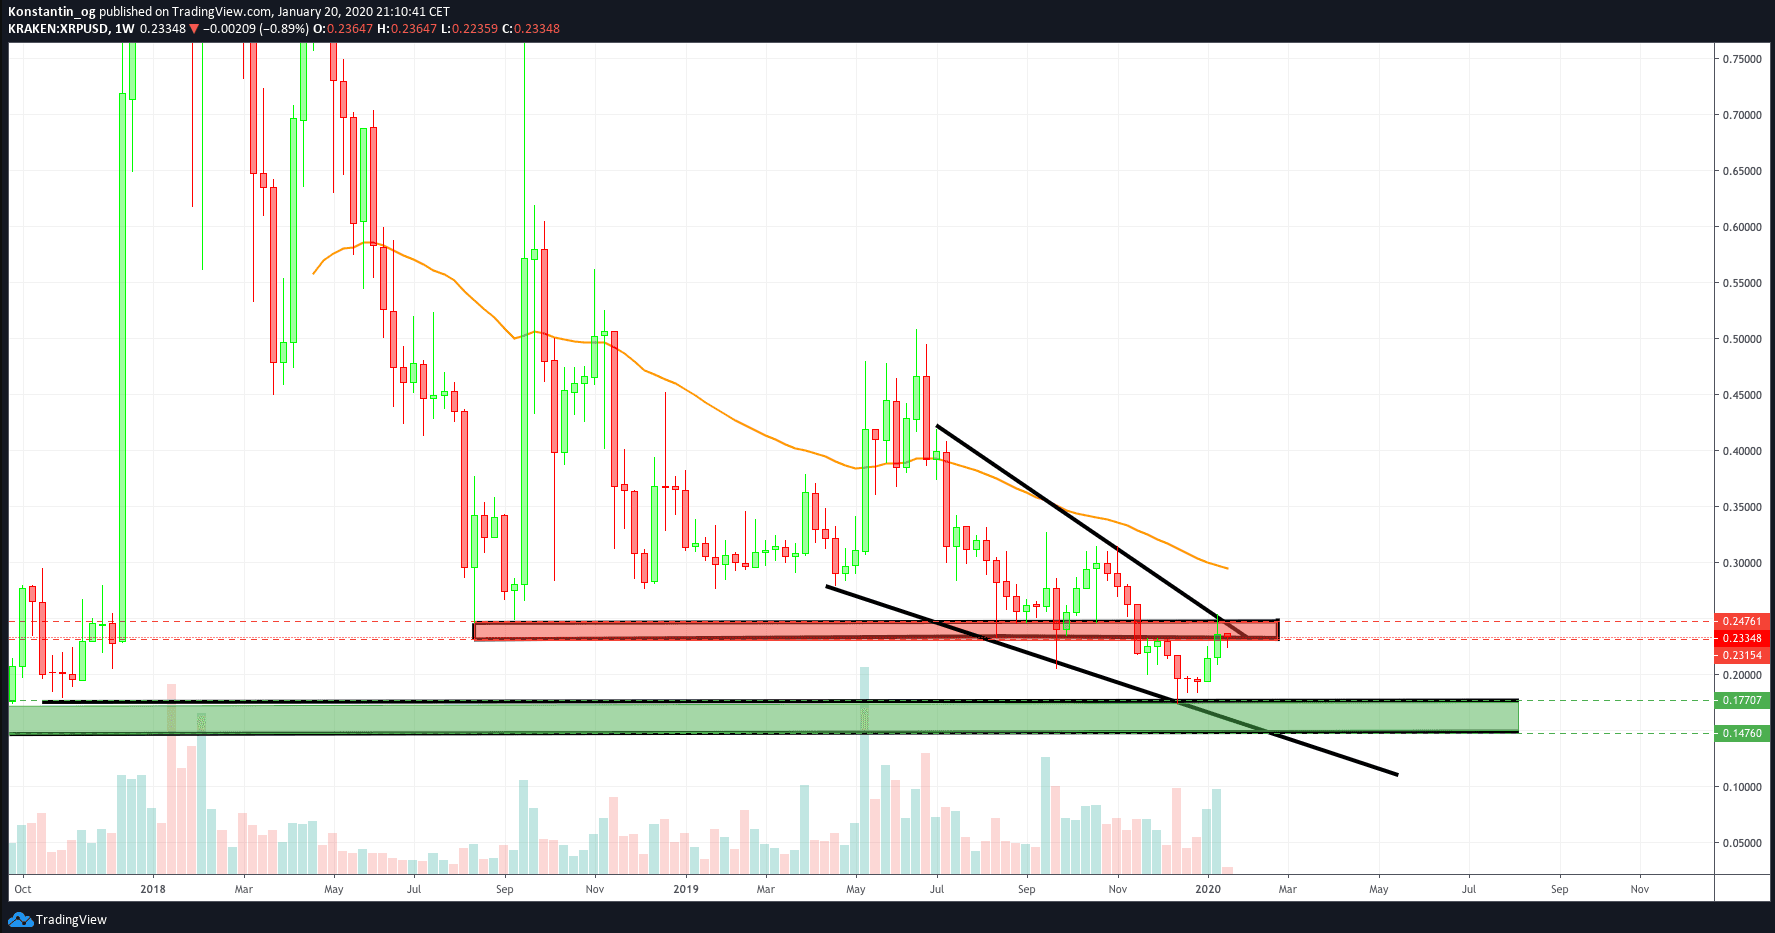
Ripple has seen a steady downward trend since January 4, 2018. Now it has bounced off with a very strong resistance, which is between $ 0.23154 and $ 0.24761. Ripple finds its next support between $ 0.17707 and $ 0.14760.
Continuing downward trend: Ripple price

It actually looks bad for the ripple price. It will soon find support, but that could also be last. The major resistance, which is between $ 0.23154 and $ 0.24761 at the lower half of the 0.236 Fib level, needs to be broken for Ripple to be bullish.
The only thing left for the people to hope for is a kind of bottoming out of the support. If Bitcoin turns up, Ripple will follow suit. But just because Ripple is in a bear trend doesn’t mean there are no positive prospects for Ripple bulls. After all, you have to keep in mind the huge volatility. Even the small move from support to resistance was 46% up. Under the premise that Ripple does not fall to 0, there could very soon be a kind of consolidation on the lower trend line of the emerging, falling wedge. As a result, Ripple could break out of the falling wedge’s bullish price pattern. A possible price target would then be $ 0.30. But this is only speculation and it remains to be seen how Ripple will behave in support.
Top 5 Altcoins: Bitcoin Cash (BCH) price forecast

Bitcoin Cash has bottomed out and has risen 138% since then. Now Bitcoin Cash has bounced off the golden ratio, and the weekly candle is initially below the 0.5 Fib level. Closing this candle below this level would be bearish. However, Bitcoin Cash has found short-term support on the 50-month EMA. In general, the Bitcoin Cash price is not looking bad, it has rebounded strongly from its support and is in a symmetrical triangle (neutral), while the RSI makes higher lows and the MACD moves up (bullish). The MACD lines have also crossed bullishly.
Still, Bitcoin Cash has to break $ 385 to be bullish. After that, it finds violent resistance between $440 and $ 480. Otherwise, Bitcoin Cash will find strong support at $ 300 and between $ 170 and $ 200. In the short term, Bitcoin Cash is more likely to move down.
Top 5 Altcoins: Litecoin (LTC) price forecast

The Litecoin rate is in a descending triangle and has been in a downward trend since December 2017. The MACD is showing bullish signs because the MACD lines have already crossed bullish and the histogram has been rising since October 2019. The RSI has bullish tendencies as it shows a very small bullish divergence. Initially, however, Litecoin rebounded between $ 59 and $ 65, where the 0.236 Fib level is and slightly above, the 50-week EMA. It will be interesting to see whether Litecoin can break the resistance.
If not, the Litecoin exchange rate between $33 and $36 expects very strong support. If Bitcoin declines, the chances are very high that Litecoin will move down accordingly.
>> Secure your cryptocurrencies in a Trezor wallet. <<
Top 5 Altcoins: EOS (EOS) price forecast

EOS has increased over 100 percent in the past five weeks. However, EOS is also in a triangle and from lower trend line EOS has rebounded violently. It is between $ 3.6 and $ 4.2 horizontal resistances, the 0.236 Fib level, and the 50-week EMA. Since EOS is exactly at the 0.236 Fib level, it will be interesting to see whether EOS will break this level or fall below it. EOS will only find support at $ 2.6 again.
The only positive prospects suggest that the histogram of the MACD, which is moving steadily upwards, while the MACD lines have already crossed bullishly. However, indicators of this type are only a means of confirmation and should never provide the basis for the price forecast.
>> You want to buy EOS at the current EOS price? Register with Binance! <<
Top 5 Altcoins:Binance Coin (BNB) price forecast

Binance coin is on several resistors. First of all, a horizontal resistance at $ 17.5 and $ 18.2, as well as the 50-week EMA that is also there. Also at $ 19.32 is the 0.236 Fib level. If Binance Coin can’t break this resistance, it will find strong support at $ 11.9.
The MACD indicates a bullish crossover while the histogram has been moving up for over five months. If Binance Coin breaks the current resistance, the next resistance would be around $ 21.