
Ethereum Price Analysis: Key Levels Saving ETH Coin From CRASH
The crypto market experiences broad downside pressure. Here are key technical levels shielding $ETH coin from a larger crash below $2,000.




Which topics should we dive deeper into?
Select what genuinely interests you. Your picks feed directly into our editorial planning.
Crypto news that's actually worth your time.
Weekly. 60 seconds. Carefully curated by our editors: no hype, no promo flood, no spam.
After a brutal multi-week downtrend stemming from the $2,500 region, the Ethereum price is currently trading at $2,075, hovering above the psychologically vital $2,000 baseline.
The central question is whether the current consolidation is the final pause before a catastrophic $ETH coin crash below $2,000, or a classic liquidity hunt designed to trap short-sellers before a sharp bullish reversal.

How Other Cryptos Are Performing
The current weakness in $ETH does not exist in a vacuum; it is part of a systemic pullback visible across the entire crypto ecosystem. Heavy institutional liquidations and spot ETF outflows are weighing heavily on major assets:
- Bitcoin ($BTC): The premier cryptocurrency has lost its grip on the crucial $76,000 support level, down roughly 1.2% over the last session to trade near $75,800. A multi-day streak of net outflows from major U.S. spot Bitcoin ETFs has dented the near-term bullish momentum for $BTC.
- Ripple ($XRP): Despite positive fundamental updates to the XRP Ledger (XRPL), $XRP has steadied around $1.32. A failed local breakout keeps the asset locked within a narrowing trading range, closely tracking $BTC's macro pullbacks.
- Solana ($SOL): Much like $XRP, Solana has faced structural headwinds, sliding down to approximately $84 despite recording occasional green ticks in its isolated fund inflows.
Compared to its peers, $ETH has notably underperformed over the past month due to an extended ten-day streak of negative ETF flows, placing its immediate technical floors under maximum stress.
Ethereum Price Analysis: Deciphering the $2,000 Floor
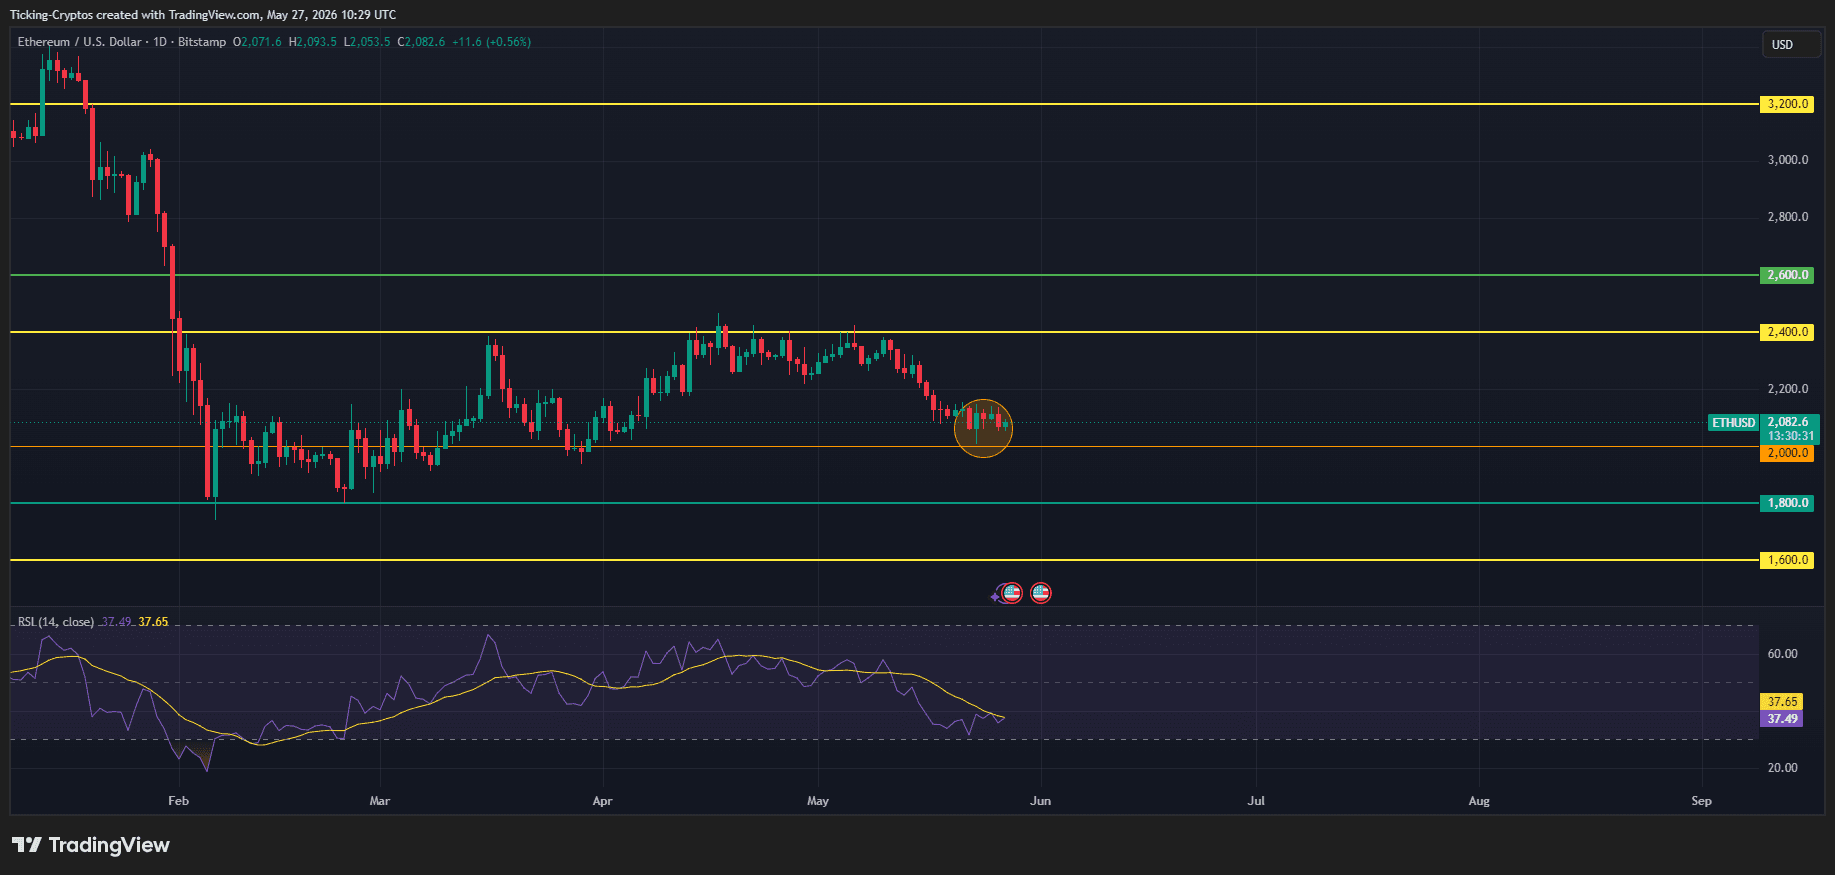
An analysis of the daily ETH/USD chart reveals a highly defined horizontal support and resistance matrix that has dictated price action throughout the year.
The $2,100 Breakdown and the Orange Zone
Over the past few weeks, the $2,100 level served as a firm structural floor, repelling multiple downside attempts. However, the chart shows that after three successive tests, this defensive perimeter finally gave way. The price has descended into the orange-highlighted circle, finding temporary friction just above the primary horizontal support at $2,000.
When a critical level like $2,100 breaks, it typically triggers momentum expansion toward the next major psychological boundary. In this case, the $2,000 level represents the absolute line in the sand for macro bulls.
RSI Momentum: Approaching Oversold Territory
Complementing the candlestick structure is the Relative Strength Index (RSI), currently registering at 37.49, with its moving average sitting slightly higher at 37.65.
- Bearish Continuation Risk: Because the RSI has not yet dipped below the traditional oversold threshold of 30.00, there remains mathematical room for a final flush downward to sweep liquidity beneath $2,000.
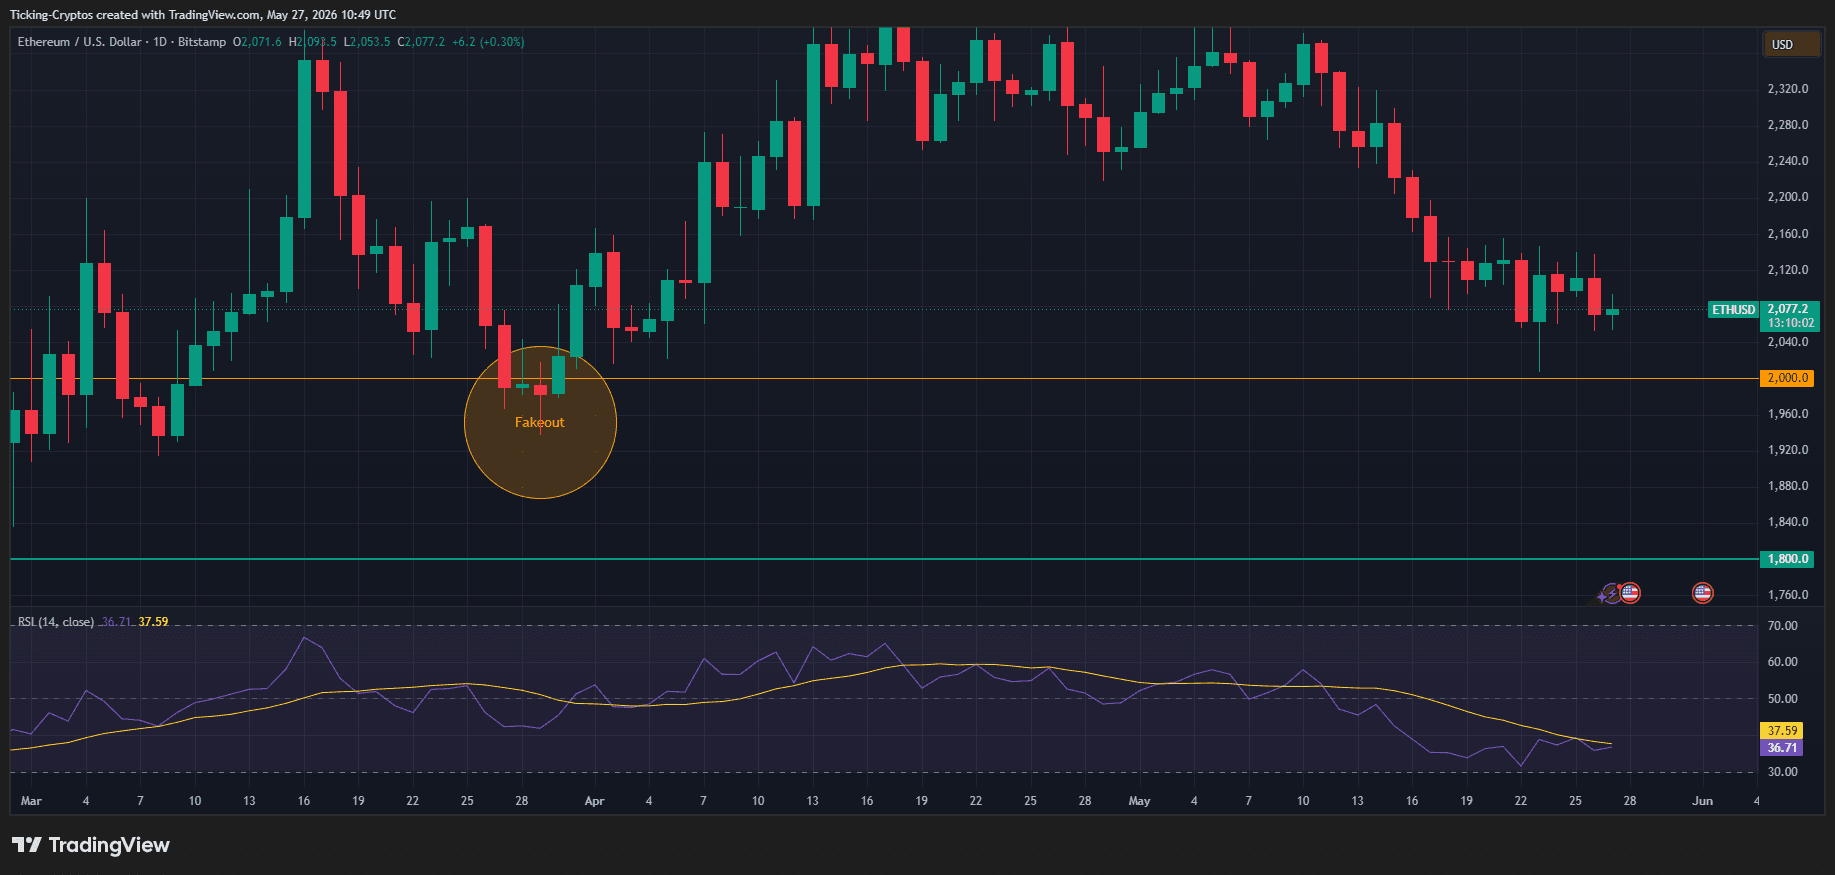
- Bullish Divergence Potential: Conversely, the flattening out of the RSI while price makes lower local lows indicates that selling pressure is beginning to exhaust itself. This exhaustion is a primary prerequisite for a market fakeout.
The Bear Case: A Clean Break and Descent to $1,800
If macroeconomic headwinds—specifically via hotter-than-expected inflation metrics or persistent spot ETF outflows—continue to dominate the news, a clean breakdown becomes highly probable.
In a strict bearish continuation scenario, a daily candle closing decisively below $2,000 will invalidate the local accumulation thesis. This would effectively turn the $2,000 floor into a formidable overhead resistance level. According to historical volume profiles shown on the chart, the next defensive bastions for buyers are situated at $1,800 (marked by the teal horizontal line) and $1,600 (marked by the lower yellow support line).
Traders looking to manage their risk safely during such structural shifts often utilize secure storage solutions, which can be reviewed on our comprehensive guide to hardware wallets.

The Bull Case: The Liquidity Sweep and "Fakeout" Blueprint
Despite the grim short-term price action, several institutional and underlying variables point heavily toward a potential bullish fakeout (also known as a spring or bear trap) rather than a complete market collapse.
- What is a Market Fakeout? A fakeout occurs when an asset's price briefly breaches a well-known support level to trigger stop-loss orders and liquidate over-leveraged long positions. Once this deep pool of liquidity is absorbed by major market makers, the price rapidly and aggressively reverses in the opposite direction.
Institutional Accumulation Signals
While retail sentiment remains fearful, deep-pocketed entities are treating this correction as a premier buying window. Massive corporate treasuries and institutional buyers have been taking advantage of the sub-$2,200 discount, showing that structural demand remains strong under the surface of the spot market.
Furthermore, recent efforts to minimize operational selling pressure from major ecosystem foundations are helping establish a cleaner fundamental launchpad for the asset.
If a fakeout occurs, expect the price to momentarily wick down to the $1,950–$1,980 range to sweep stops before closing the daily candle back above $2,020. This behavior would confirm a structural failure to break lower, rapidly shifting momentum back toward the overhead targets at $2,400 and $2,600.
More on Ethereum: All Ethereum news at a glance
Related articles
- Ethereum Price Crash: What Next Support Levels For ETH Price Below $3K?
- Ethereum Prediction: ETH Coin Falls Below $1,700 – Here Are the Next Supports
- Is an Ethereum Price Crash Imminent?
- Ethereum Price Prediction 2026: Technical Analysis of ETH Coin During the Crypto Crash
- Ethereum Price DANGER: Will ETH Hold $2,200 Amid Global Macro Chaos?
Which topics should we dive deeper into?
Select what genuinely interests you. Your picks feed directly into our editorial planning.
Crypto news that's actually worth your time.
Weekly. 60 seconds. Carefully curated by our editors: no hype, no promo flood, no spam.

July 8, 2024 7:51 AM

Crypto Market Crash News As BTC Price Crash Back To 56K
With the crypto market crash, and Bitcoin price drop to below 56k with recent dormant BTC whales activity, what comes next: a correction or further crash soon?
June 2, 2026 12:13 PM
Ethereum Price Crashing Below $2,000 as Bitcoin Breaks Critical $70,000 Support
Ethereum has plunged below the psychological support level of $2,000 following a sharp market-wide correction triggered by Bitcoin breaking below $70,000.

April 6, 2026 6:24 PM

Ethereum Price Analysis: ETH Consolidates Between $1,800 and $2,100, What’s Next?
Ethereum price is stuck in a tight range between $1,800 and $2,100. Analysts warn of a decisive breakout or breakdown as volatility reaches a boiling point.
February 18, 2026 6:53 AM

Ethereum Price Prediction: Will the $2,000 Support Hold or Is a Deeper Correction Looming?
Ethereum price struggles to maintain the $2,000 psychological level. Analyze the latest ETH coin news and price predictions for 2026 amid market consolidation.
January 31, 2026 7:26 PM

Ethereum Crash: ETH Coin Plummets 12% as Volatility Grips Crypto Market
Ethereum price plummeted over 12% in 24 hours, hitting $2,400. We analyze the ETH chart and the macro triggers behind this massive crypto sell-off.
May 16, 2026 2:22 PM

Ethereum Price Analysis as ETH risks Crashing below the $2,000 Support
Ethereum struggles to stay above key support levels. Technical charts and rising exchange inflows indicate that ETH could drop below $2,000 soon.
November 17, 2025 8:55 PM
BREAKING: Ethereum Price Crashes Below $3,000 as Bitcoin Triggers Market Meltdown
Ethereum drops under $3,000 after Bitcoin’s fall below 92K. Chart signals deeper weakness as key support levels fail.
May 23, 2026 2:24 PM

ETH Price Prediction Amid Market Sell-off: Will Ethereum Crash Below $2,000?
Ethereum faces a critical breakdown test as the global crypto crash intensifies under escalating US-Iran tensions and a massive Chinese military deployment near Taiwan.
February 24, 2026 4:28 PM

Can Ethereum Price Crash to $0? Analyzing Ethereum Blockchain
Ethereum's price is under pressure as the crypto market faces a downturn. We analyze if ETH can truly hit $0 and what its ecosystem value means for the future.
June 1, 2026 7:51 AM

Ethereum Price Breaks $2,000 Support While Bearish Sentiment Drives ETH to Lower Targets
Ethereum has dropped below the crucial $2,000 psychological level. Technical indicators hint at further losses toward a stronger support area.
February 9, 2026 6:30 PM

Ethereum Price Prediction: ETH Coin Might Sink Below $1,900 as Bitcoin Loses $70,000
Ethereum faces heavy pressure as Bitcoin drops below $70,000. Here are the key ETH support levels at $1,950 and $1,880 in our latest price prediction.
August 2, 2025 10:30 AM

Ethereum Crash to $3.5K: What ETH Coin Needs to Avoid a Deeper Fall
Ethereum tumbled to $3,534 after the Fed left interest rates unchanged. With momentum fading and BTC leading the drop, ETH is under pressure. Will $3.2K hold next?
April 6, 2025 9:27 PM

Crypto Market Crash Updates: Will Solana Crash Below $100 as Bitcoin Falls Under $80K?
The crypto market just shed over 5% in value, with Bitcoin dipping below $80K and Ethereum sliding under $1,700. Solana is now trading at $107. So will SOL crash below $100?
September 4, 2024 8:10 PM

Bitcoin Price Volatility Is Moving BTC Price Down, But For How Long?
As Bitcoin price faces market turbulence, the factors driving its recent volatility, from stock market impacts to key technical indicators signaling potential price shifts are highly important...
March 17, 2025 8:14 PM

Ethereum Price Prediction: Will ETH Price Crash below $1K Ahead of the FOMC Meeting?
With the FOMC meeting approaching, Ethereum's price faces uncertainty. Will ETH crash below $1,000 or hold strong? Here's what to expect in the coming days.
August 10, 2024 6:02 PM

Ethereum Price Prediction: Amid Mixed Signals What To Expect For ETH Price?
Ethereum faces volatility and competition, but signs of bullish activity and whale accumulation suggest potential recovery. How does it compare to Solana, and what does the future hold for ETH?
September 5, 2024 10:00 PM

Toncoin Price Drop Below Its $4.70 Support Level Warns Of A Major Crash On The Horizon
Can Toncoin recover from its shaky position, or is a 45% price drop looming? Analysts weigh in on the crypto’s critical support level amid legal troubles at Telegram...
November 5, 2025 1:16 PM

$1 Trillion Wiped: Risk-Off Storm Engulfs Stocks & Crypto
Global markets plunge as tech stocks and crypto crash, wiping over $1 trillion in value amid AI bubble fears and investor risk-off panic.
March 31, 2025 2:09 PM

Ethereum Price Prediction: Will ETH Price Crash to $1,000? Support Level REVEALED
Ethereum price plummeted over 50% in 2025, leaving investors in panic mode. As ETH hovers dangerously near critical support at $1,800, crypto analysts warn of a potential further crash to lower levels.
April 19, 2026 6:34 PM
Ethereum Price Analysis: Key Levels Holding, Will ETH Crash or Bounce Toward $2,500?
Ethereum tests critical support near $2,330. Will ETH bounce toward $2,500 or break lower? Full price analysis and targets.
March 25, 2026 10:38 AM

Ethereum News: ETH Targets $2,200 as Geopolitical Tensions Ease and Bitcoin Reclaims $71k
Ethereum nears $2,200 while Bitcoin reclaims $71,000 amid reports of US-Iran peace talks. Here are the latest ETH chart trends and market sentiment for March 2026.
September 12, 2025 3:00 PM

Ethereum Crash Warnings? Why Analysts Might Be Wrong on ETH
Some analysts are sounding alarms over a potential Ethereum crash and calling for traders to dump ETH. But the latest chart data tells a different story.
February 28, 2025 10:10 AM

Ethereum Price Crash Below $2,200 – Will $2,000 Hold?
Ethereum is crashing hard! ETH is hovering around $2,150, dangerously close to the critical $2,000 support. If it breaks lower, bigger losses could follow!
August 13, 2025 8:40 AM

Ethereum Price Hits New High at $4,678 – $5K SOON as BlackRock Buys $318.7M in ETH...
Ethereum reached a new high of $4,678, edging closer to its 2021 record. With BlackRock purchasing $318.7M worth of ETH, the $5K milestone may be next.
February 4, 2026 8:01 PM

Ethereum Price Crash: This is the Next Support for ETH Coin
Ethereum is facing a brutal sell-off in February 2026. After losing key levels, analysts eye a much lower retest. Here is the latest ETH technical analysis.


More from CryptoTicker