Cardano Price Analysis: ADA Price Showing Bullish Pattern?
The Cardano price is currently showing good progress. The past 20 days have been very good for the cryptocurrency market. All cryptocurrencies are showing strong growth. The Cardano (ADA) has displayed an almost +3.19% growth in the last 24 hours. At the […]

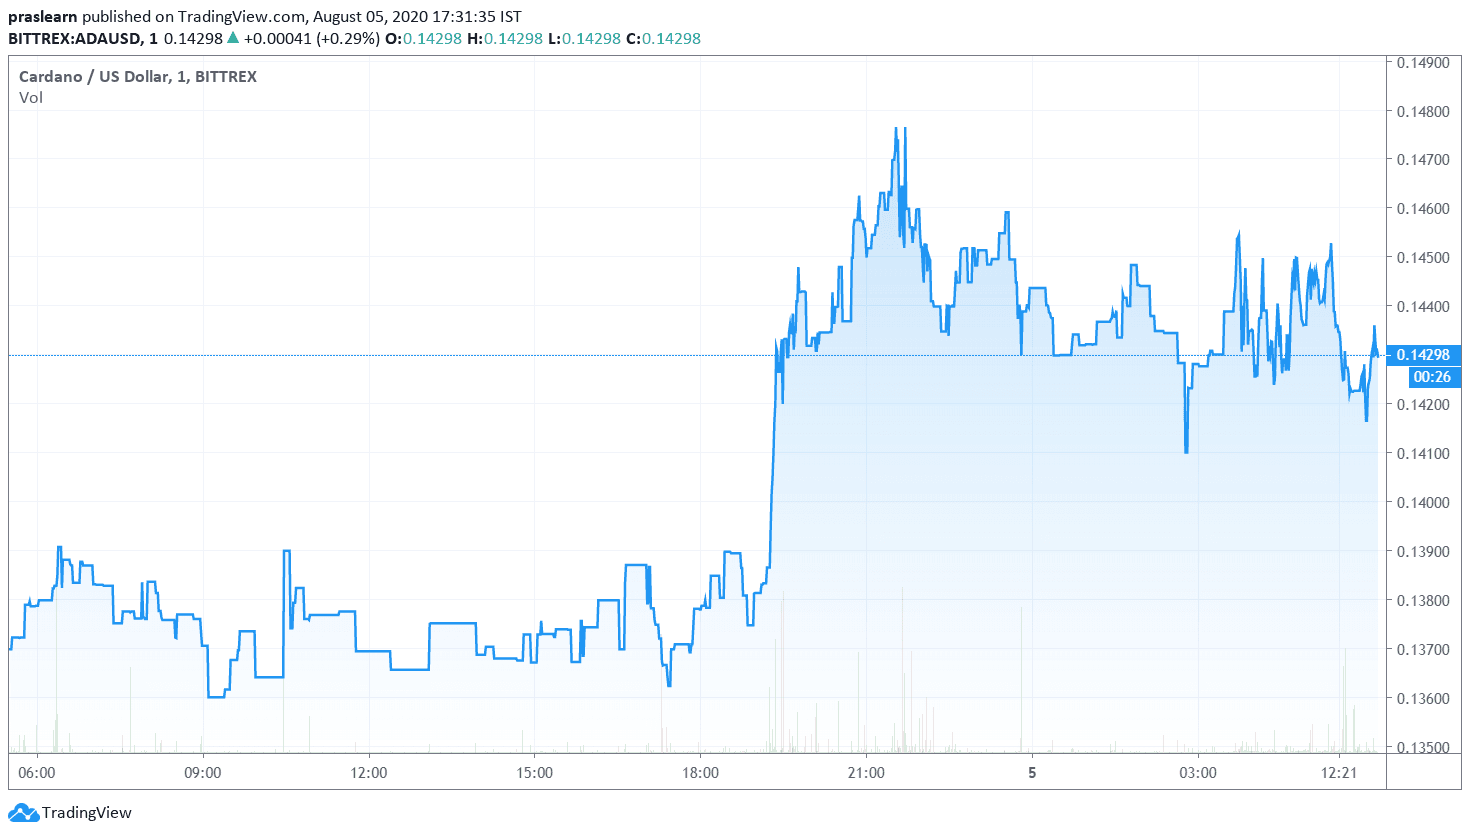
The Cardano price is currently showing good progress. The past 20 days have been very good for the cryptocurrency market. All cryptocurrencies are showing strong growth. The Cardano (ADA) has displayed an almost +3.19% growth in the last 24 hours. At the time of writing, the ADA price is trending at $0.142 (+3.19%. Is the ADA/USD price showing a bullish pattern? Let’s take a close look at it.
Cardano Price Analysis: ADA Price and the Short Term ROI
As mentioned earlier, the Cardano price is showing good overall improvement. The current ADA price stands at $0.142 with almost 3.19% move in the past 24 hours; almost 45.36% rise over a month, and almost 171.17% gain on the yearly scale.
Now, the Cardano (ADA) price was able to form a “bullish pattern” last month, after which it increased by almost 70% in the last few days! The ATH of ADA was $1.33 and currently, it is down by almost 89% from its All-Time-High (in USD) price. Now, the ADA price could increase more bullishly but if it gets rejected then the price could sail between $0.136 – $ 0.146! If the ADA price breaks the $0.146 mark then it could eventually break the horizontal resistance too. The key metrics are as follows:
Price $0.143
24hr Change +3.17%
24hr Vol $87,652,748
Liquid Marketcap $4,496,324,234
Liquid Supply 31,520,050,161
Max Supply 45,000,000,000
Cardano Price Analysis: Short Term ROI of ADA Price looks Promising
Now, against Bitcoin, the ADA price has changed by almost +1.62% in the last 24 hrs. The range of Cardano Price in USD from the lowest and highest trading prices over the last hour is between $0.141 – $0.143 and the range between the ADA’s lowest and highest trading prices over the last 24 hours is between $0.136 – $0.148.
The Cardano price performance (ROI) over the past 7 days, vs USD, has been increased by almost +2.01% and its price performance (ROI) over the past 90 days, vs USD, is almost 178%. So, it seems that the short term ROI is promising but the volatility of ADA over the past thirty days is 1.9. So, all the good things could depend on the next target price of $0.148. If ADA fails to crack the $0.148 price mark then it could drop to $0.138.
Conclusion
The position in the ADA/BTC market could be crucial for the altcoin as the Cardano price (ROI) against BTC has decreased by almost -0.30%. From the beginning of this month (August) the ADA price performance (ROI), to right now, vs USD has decreased by almost -1.12%. So, it will be interesting to see how the ADA price behaves from here. We wish you happy trading!