Is a bear market around the corner for Bitcoin? What Harmonic Patterns say about BTC’s future in 2022
Technical Analysis may be the tool to enravel the secrets of the cryptocurrency markets in 2022. Is it possible that chart analysis and Harmonic Patterns predict the price trends for the current year? Let's analyse Bitcoin's chart to find out!

Bitcoin has been one of the most volatile assets since its inception in January 2009. Its meteoric rise to $68,900 USD in November 2021 marked yet another record for the first cryptocurrency. Nevertheless, taking a look at the actual panorama for 2022, things may look grimmer than last year. Cryptocurrencies are facing strong regulatory hauls worldwide that could slow down the growth of the ecosystem. So far, within two months, cryptocurrencies have been losing value, and the question remains unanswered, can we expect a further drop in price for Bitcoin and other cryptos, or are we going to see the meteoric rise to the moon continued in 2022?
Lots of fundamental analysis can be done in order to respond to this question. Nevertheless, something usually very overlooked is how important chart technical analysis could be for predicting Bitcoin and other cryptocurrency trends.
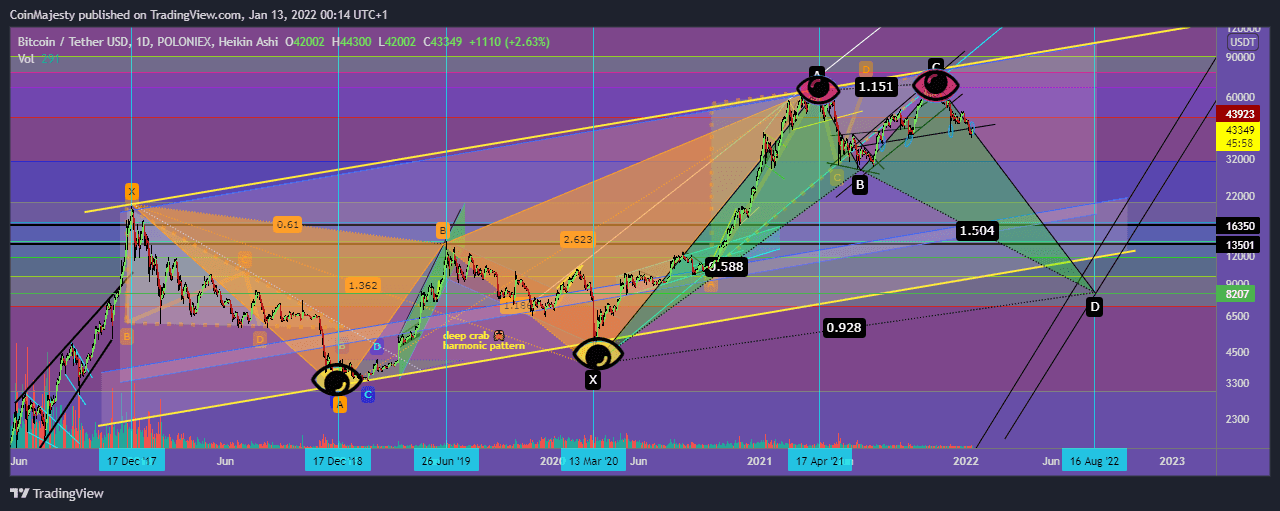
Let’s have a look at Bitcoin between December 2017 and April 2021.
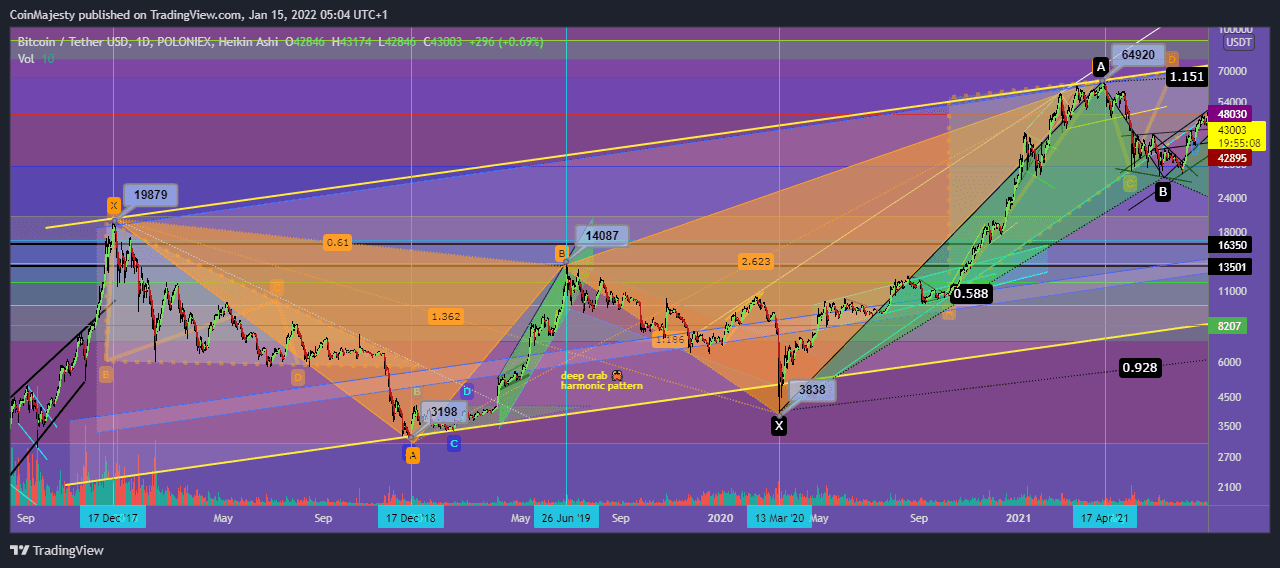
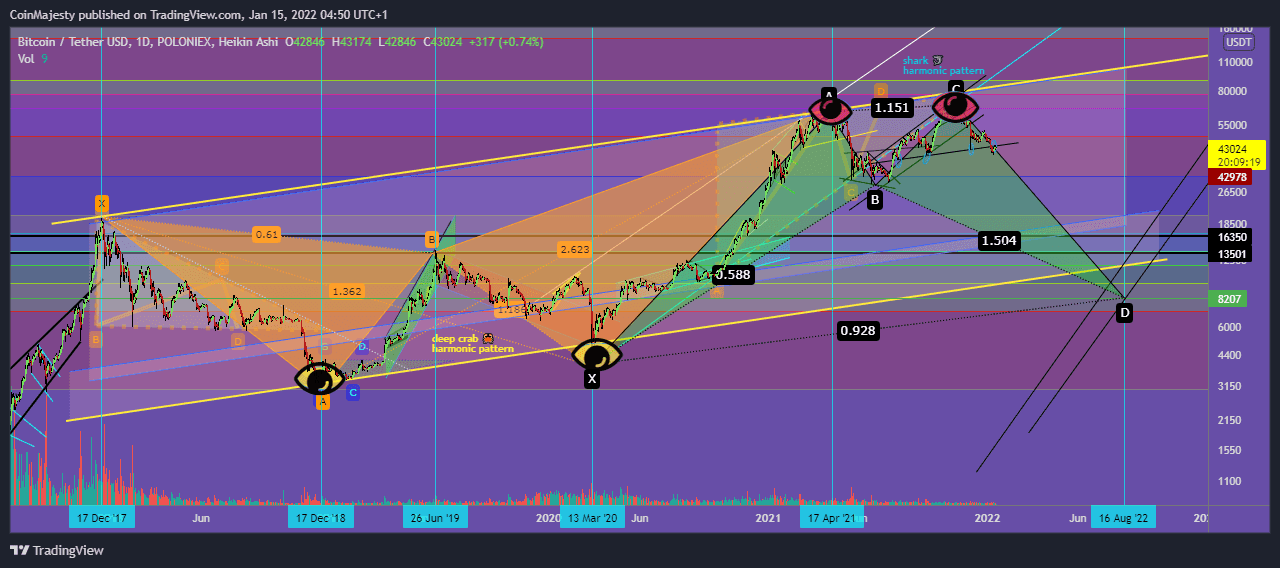
There are two main characteristics we can see in this chart. The first one is, the price is moving within a rising channel. This channel is extremely volatile within its three and a half years timeframe. We can see how prices fluctuate between $19,800, then down to $3,200, then up to $14,000, then down to $3,800, to finally go up and reach $64,800. This extreme price fluctuations, in such a years-long timeframe, created a geometric figure most market analysts haven’t noticed yet: a harmonic pattern.
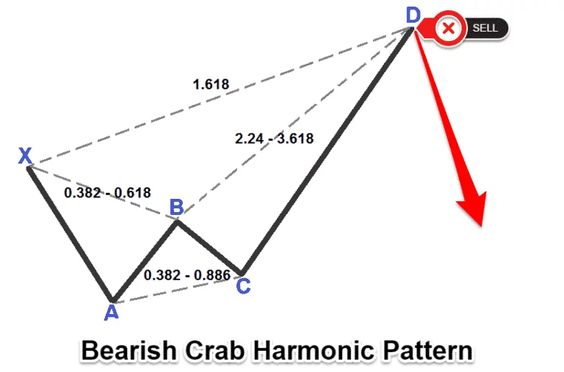
This massive (orange) harmonic pattern resembles a Deep Crab Harmonic Pattern the most. It’s pivot points are the 2017 bubble peak, the bottom in 2018 exactly one year later, the unexpected bounce to $14,000, and the March 2020 flash crash due to the start of the Covid-19 pandemic. All of this encompassed within the rising channel previously mentioned.


Now we can fairly say by looking at the current chart that this harmonic pattern may have played out. If we then take a look at what happened after this pattern was concluded, we can see that the price of BTCUSD dropped to $28,700, to then bounce back up to a new All Time High in November 2021 at $68,900.
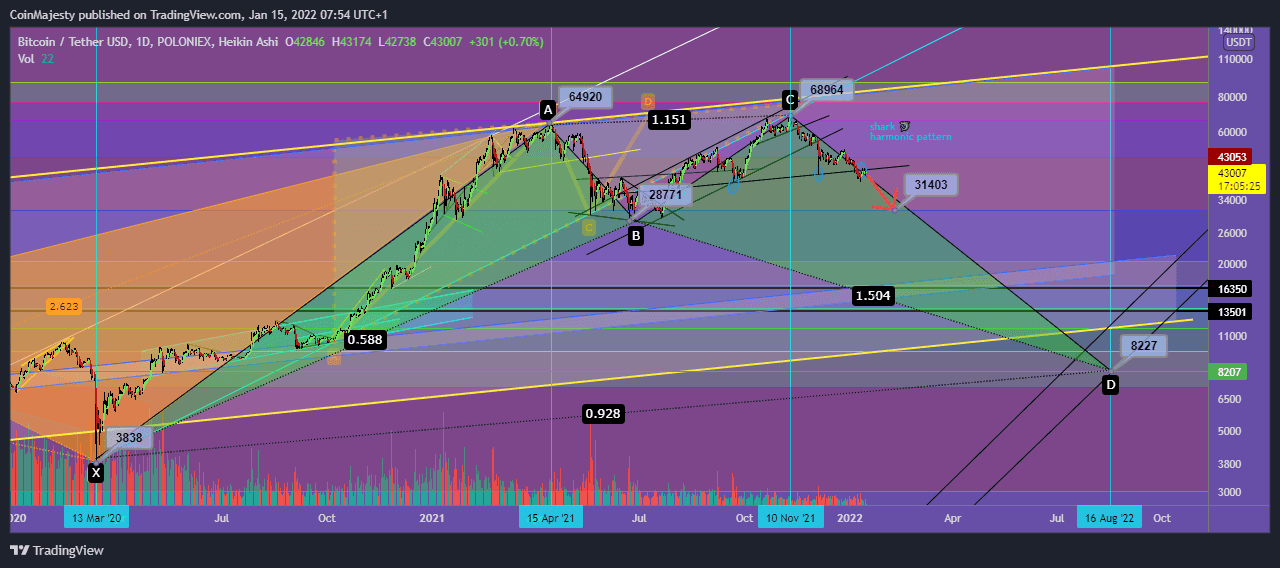
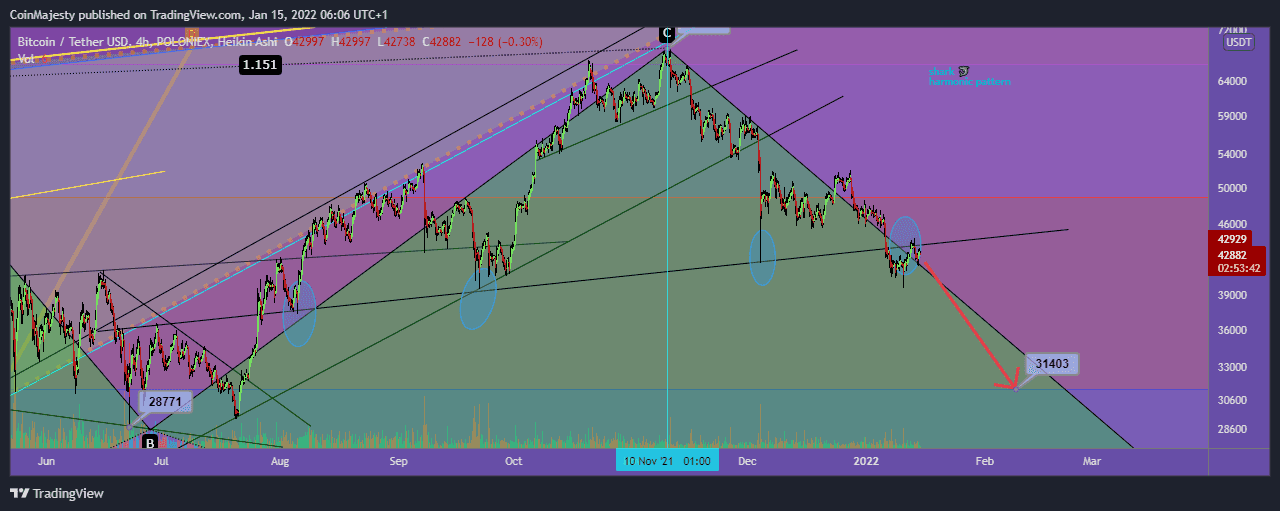
It is currently very likely that we are seeing a new Harmonic Pattern happening now. The current price structure and volatility is still encompassed within an ascending channel, and if we go back down to the bottom of the channel, we could be seeing prices below $10,000 per BTC. The possible current Harmonic Pattern starts at April’s 2021 high, at $64,900, then moves down to $28,700, to then move back up to a second “blow off top” in November 2021. After this last top about two months ago, we have only seeing the prices drop.
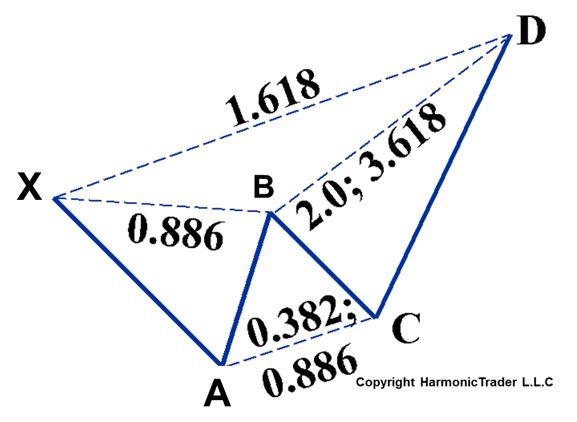
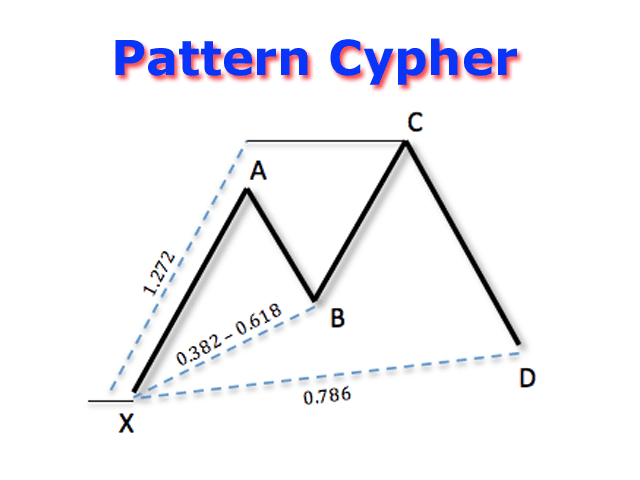
After extensive analysis and comparison, it is my opinion and main argument that we are now within a Bullish Cypher Harmonic Pattern.
Unfortunately, in case this bullish Harmonic Pattern plays out, it means we could see the prices dropping to the bottom of the channel to lows even below $10,000. I believe because of a supossed “glitch” that occurred on the Binance exchange in September 2021, the price of the bottom of BTC has already been set by certain whales to $8200, in case it drops below $10,000. Dropping to such low levels may be necessary in order to break the bullish ascending triangle Bitcoin is in since more than four years ago.
By the looks of it, I expect the bottom of this Harmonic Pattern to be between $8,200 – $11,700. The date, as the analysis goes, should be sometime in the middle of the year 2022, around the month of August.
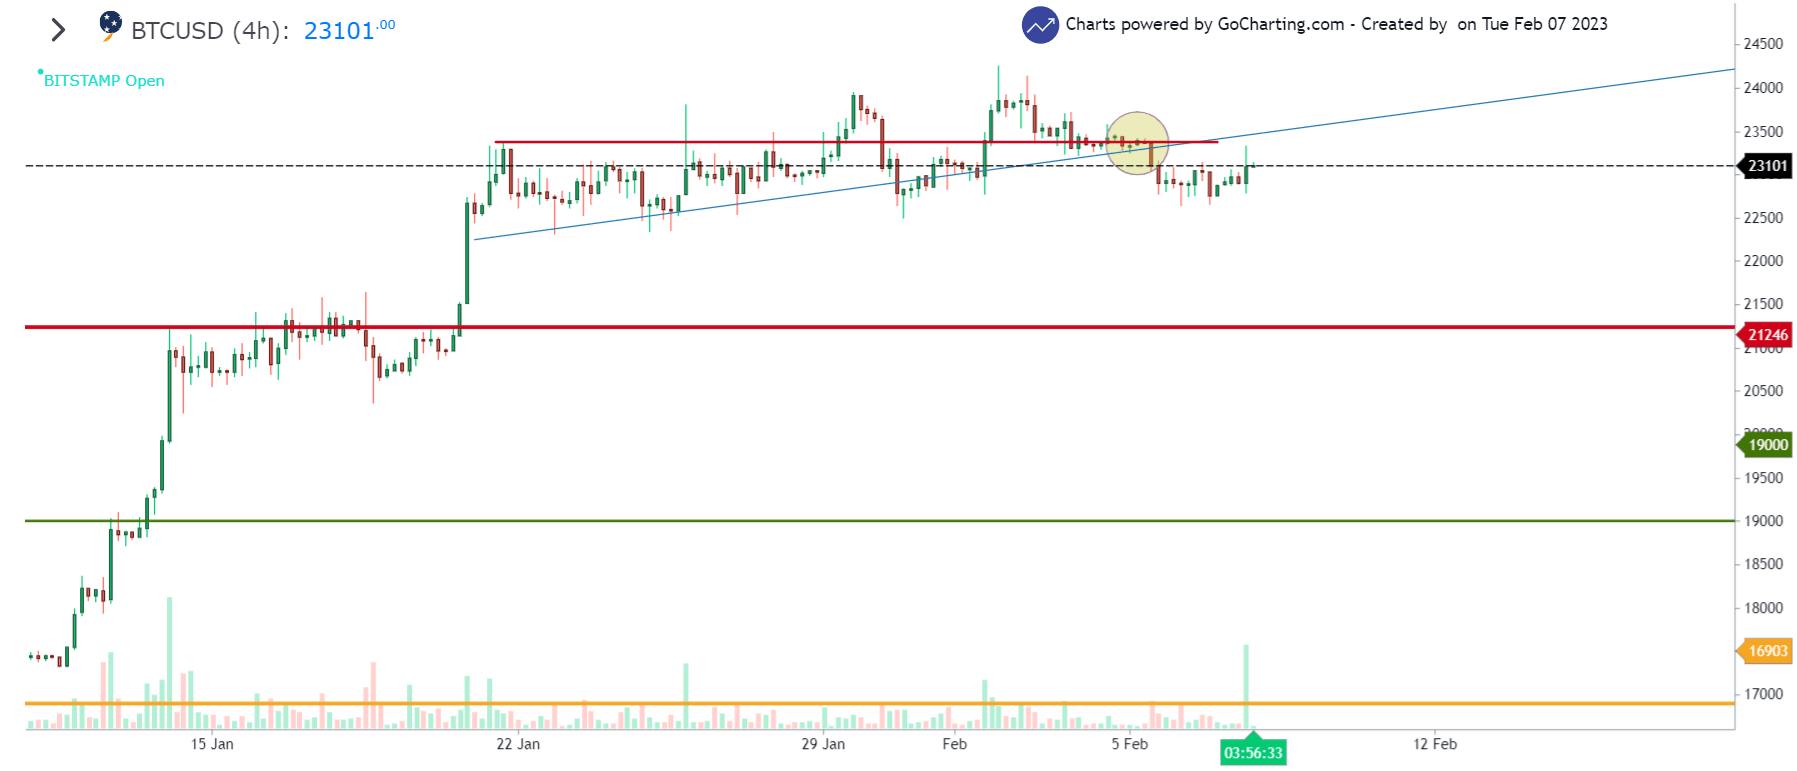
Finally, if we take a look at BTC in it’s 4h timeframe, we can see that the price action is currently been rejected to go back to the levels it had been since August 2021.