Ethereum Price Crash: This is the Next Support for ETH Coin
Ethereum is facing a brutal sell-off in February 2026. After losing key levels, analysts eye a much lower retest. Here is the latest ETH technical analysis.


Ethereum Sell-off Intensifies: Why is ETH Crashing?
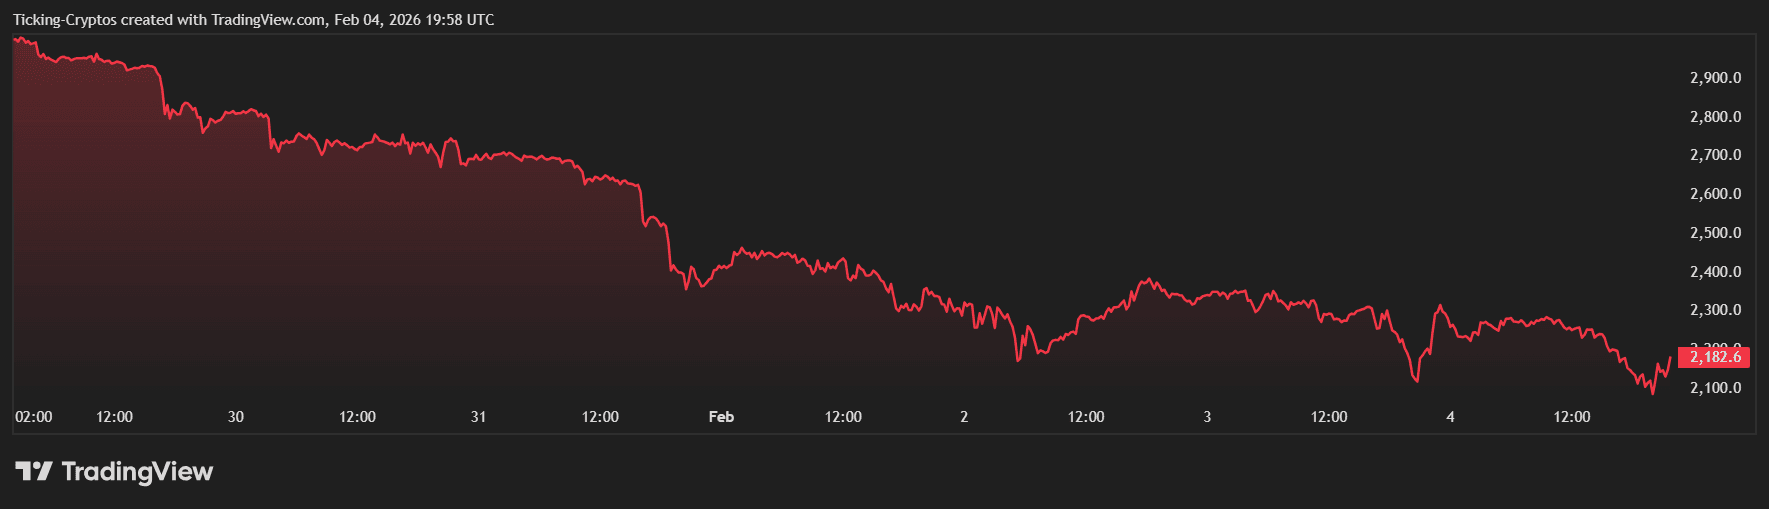
The crypto market is currently witnessing a significant "bloodbath" as we head into February 2026. Ethereum (ETH) has seen a sharp decline, dropping nearly 25% in value over the last seven days. This downward momentum was accelerated by a massive liquidation event on February 1st, where over $2.5 billion in positions were wiped out across the market.
Several factors are fueling this crypto news cycle. Institutional outflows from Ethereum ETFs have been persistent, with major players like BlackRock reportedly moving large amounts of ETH to exchanges. Furthermore, a "hawkish" shift in U.S. Federal Reserve expectations following the appointment of Kevin Warsh as Fed Chair has dampened the "risk-on" sentiment that previously fueled the 2025 rally.
Technical Analysis: Analyzing the ETHUSD Chart
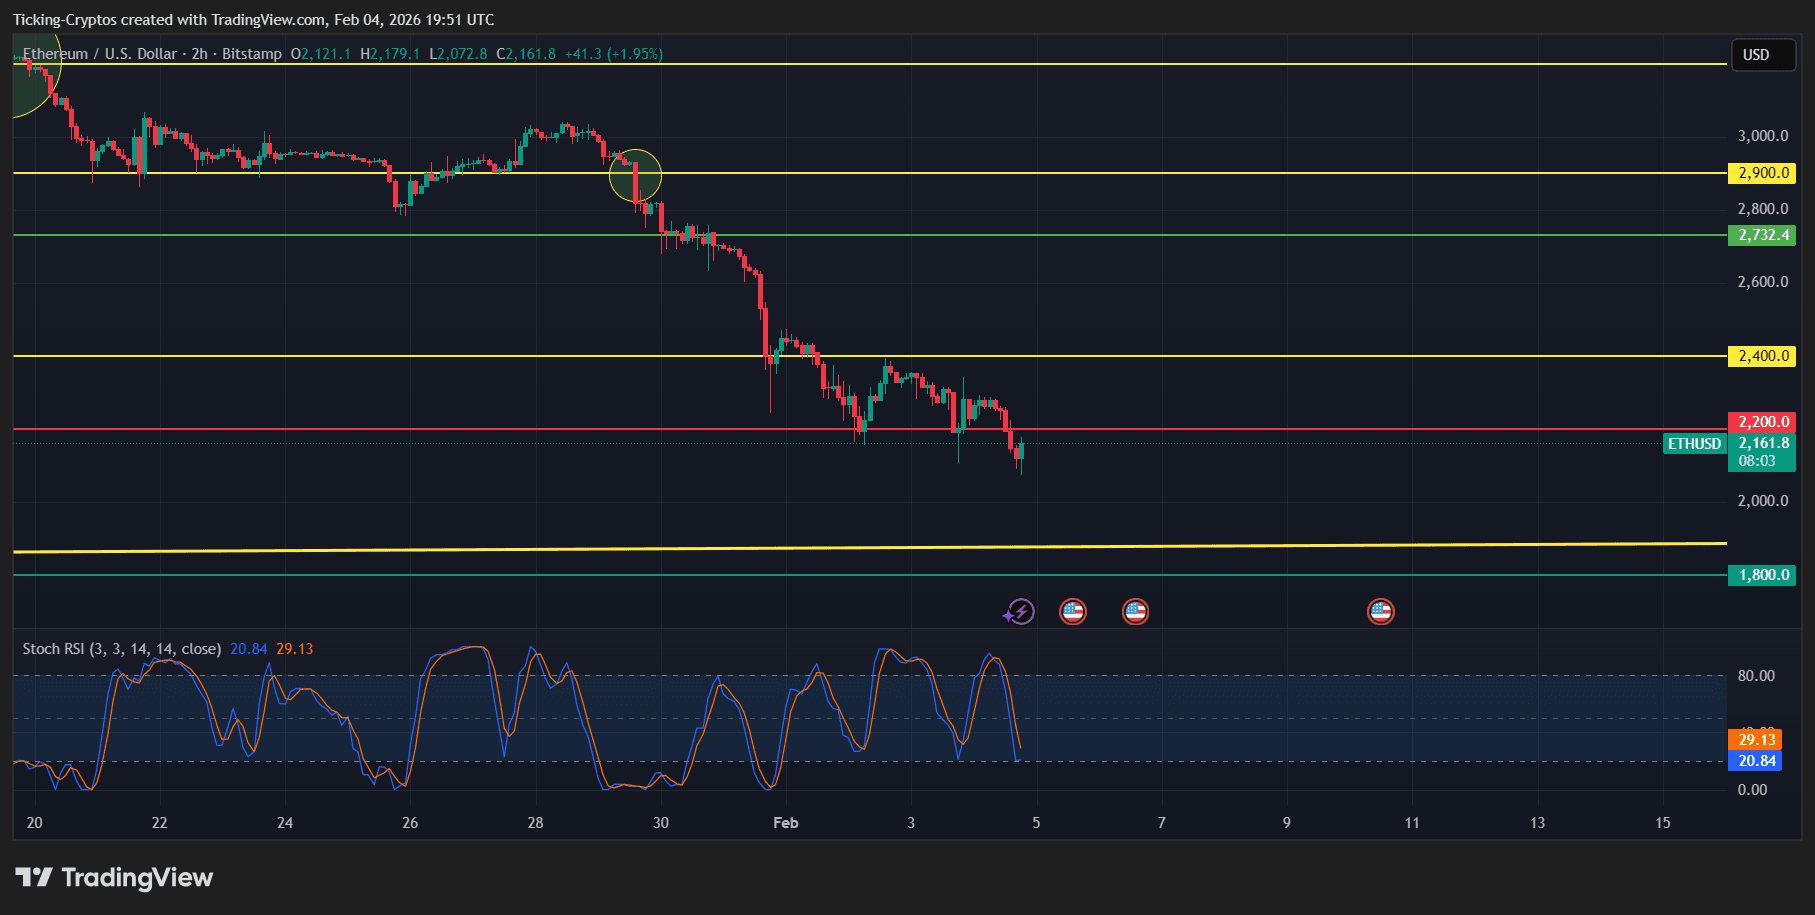
Looking at the current ETH price, the structure has turned decidedly bearish. The price recently failed to maintain the critical $2,500 psychological level, which has now flipped into a heavy resistance zone.
As seen in the technical data, ETH is trading well below its 50-day and 200-day Simple Moving Averages (SMAs). The Relative Strength Index (RSI) is hovering near 30, indicating oversold conditions, yet the lack of buying volume suggests that a bottom has not yet been formed. The "Layer 2 narrative" also seems to be cooling down, adding fundamental pressure to the technical breakdown.
Ethereum Price Prediction?: The $1,800 Strong Support
With the $2,200 support zone currently under extreme pressure, traders are looking at the next major "demand zone." If Ethereum fails to reclaim $2,350 in the short term, the path toward $1,800 becomes the most likely scenario.
The $1,800 support level is historically significant. It acted as a major pivot point during the 2025 mid-year correction and aligns with long-term Fibonacci retracement levels. Many analysts believe this area will serve as a "liquidity trap" where institutional buyers might finally step back in to accumulate.
- Immediate Resistance: $2,420
- Key Support 1: $2,100
- Ultimate Support: $1,800 - $1,850
For those looking to secure their assets during this volatility, comparing the best hardware wallets is a crucial step to avoid exchange-related risks. If you are considering trading this move, ensure you use a reputable platform by checking our exchange comparison page.
Market Sentiment and Macro Outlook
The "Fear & Greed Index" has plummeted into the "Extreme Fear" zone (currently at 15), a level not seen since the 2022 bear market lows. While extreme fear is often a contrarian buy signal, the macro environment—marked by geopolitical tensions in the Middle East and tightening U.S. liquidity—suggests that the "digital gold" narrative is being tested. According to data from Bloomberg, the correlation between equities and crypto remains high, meaning a recovery in the Nasdaq might be required before Ethereum can see a sustained bounce.