BREAKING: XRP Holds $2 as Bitcoin Crashes Below $90K, But Can the Support Survive?
XRP is fighting to stay above $2 while Bitcoin slides under $90K. Charts show risk of a deeper drop toward $1.80 and possibly $1.70 next.


As Bitcoin fell sharply below $90K, the crypto market experienced another wave of panic. Despite the chaos, $XRP managed to hold the $2 level, making it one of the few major altcoins still trading near a psychological support zone.

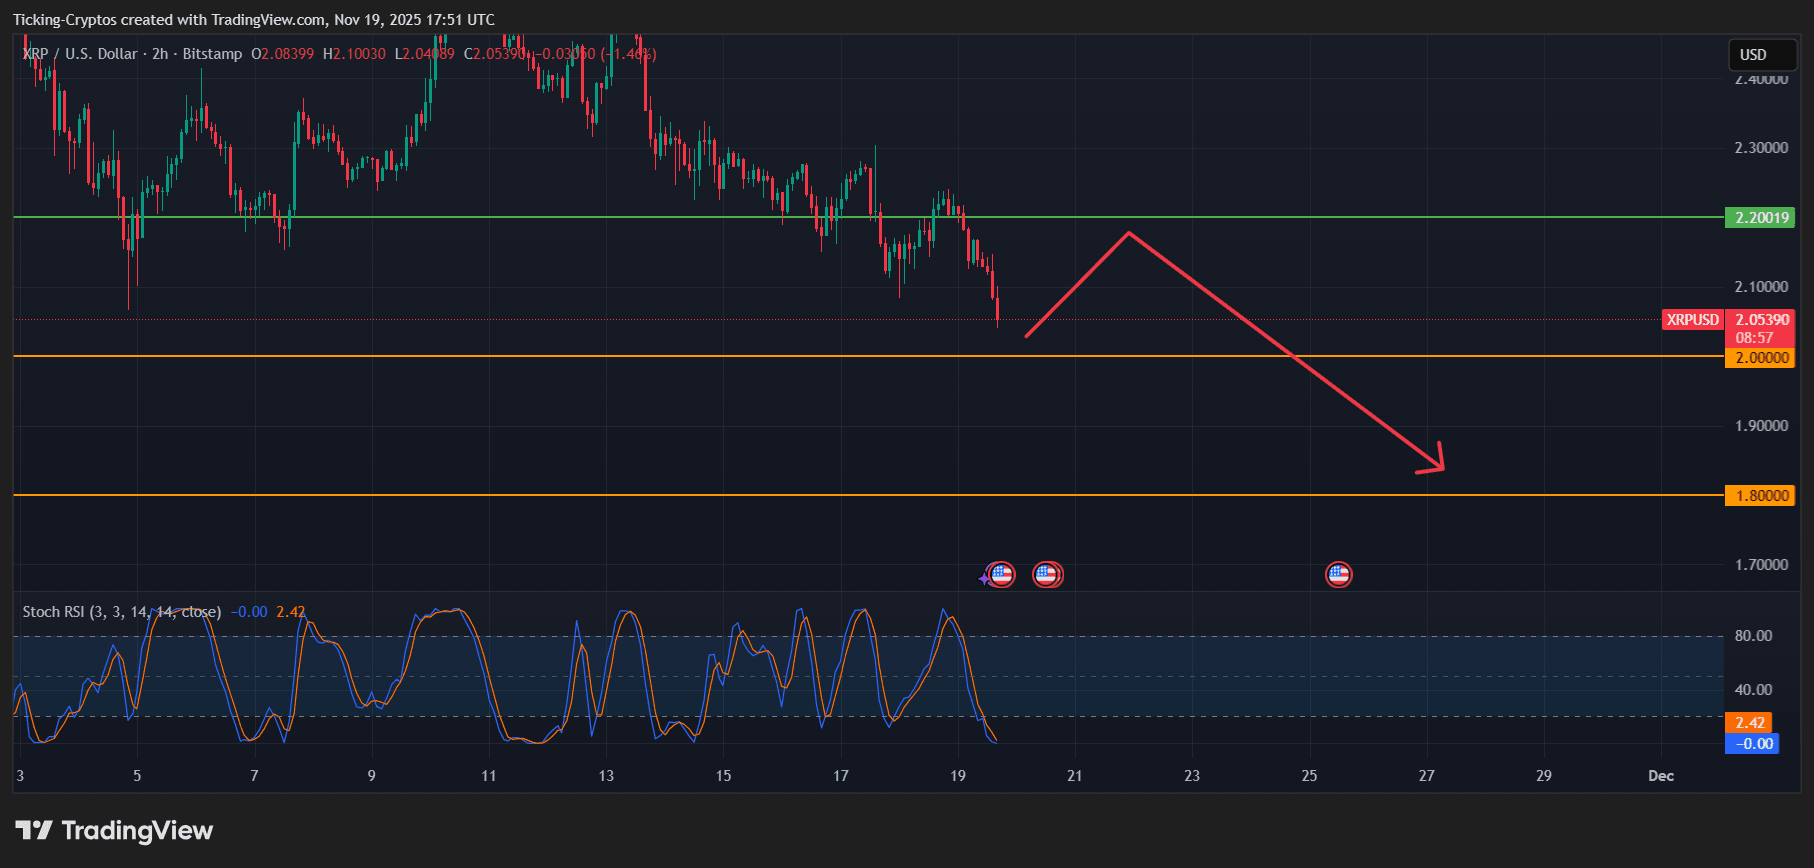
XRP/USD 2-hour chart - TradingView
But the chart shows growing weakness — and if $Bitcoin continues to drop, XRP could struggle to keep its footing.
XRP PRICE ANALYSIS: $2 Support Is Being Tested
Based on the XRPUSD chart:
1. XRP Rejected From $2.20
- The green line at $2.20019 acted as strong resistance.
- Buyers attempted a breakout but failed, leading to a fast reversal.
2. XRP Is Sitting Directly on $2.00 Support
- The orange line at $2.00 is crucial.
- Candles show declining highs and increasing sell pressure.
- With Bitcoin dropping under $90K, XRP is now reacting to macro fear rather than its own strength.
3. Momentum Indicators Are Bearish
Your Stoch RSI reading:
- Blue: ~0.00
- Orange: ~2.42
This is extremely oversold, but more importantly:
- It has not yet curled upward
- Indicates sellers still dominate
- A larger bounce may need more time
This aligns with the red arrow path drawn on your chart.
POSSIBLE SCENARIO: Small Bounce → Larger Drop
The drawn red projection on your chart suggests:
- A possible short-term relief bounce
- Followed by a strong continuation down toward lower support levels
- This is consistent with the market environment and XRP’s structure.
XRP/USD 2-hour chart - TradingView
XRP Price Prediction: NEXT TARGETS
If XRP loses the $2 level, these are the next strong areas:
🔸 First Downside Target: $1.80:
- The next orange line on the chart marks $1.80000:
- A strong previous demand zone
- A natural target if $2 breaks
- Expect high volatility if this area is tested
🔸 Second Downside Target: $1.70–$1.72:
- There's liquidity around $1.70–$1.72
- This zone matches the bottom of the recent consolidation range
If Bitcoin collapses toward $82K, XRP could very easily revisit this level
Worst-Case (for now): $1.50 Zone
- Not shown on your chart, but relevant:
- A breakdown below $1.70 would open the door to $1.50–$1.55
This requires a stronger BTC crash and market-wide panic. Not the base case yet, but important to acknowledge