What to Expect in Crypto Markets This Week: Macro Pressure Meets a Fragile Market Structure
The inflation data is back on the table, and the total crypto market cap is sitting on a fragile support zone.


Crypto market is heading into a decisive week where macro forces matter more than narratives. The daily Total Crypto Market Cap chart tells a clear story: momentum has faded, structure has weakened, and price is now leaning heavily on macro catalysts for direction. With the Federal Reserve decision and a cluster of economic data hitting the tape, this week is less about chasing upside and more about understanding risk.
What makes this setup interesting is the mismatch between expectations and positioning. Crypto market is pricing stability, but charts are showing vulnerability. That tension is where volatility is born.
The Bigger Picture: Total Crypto Market Cap Is Still in a Downtrend
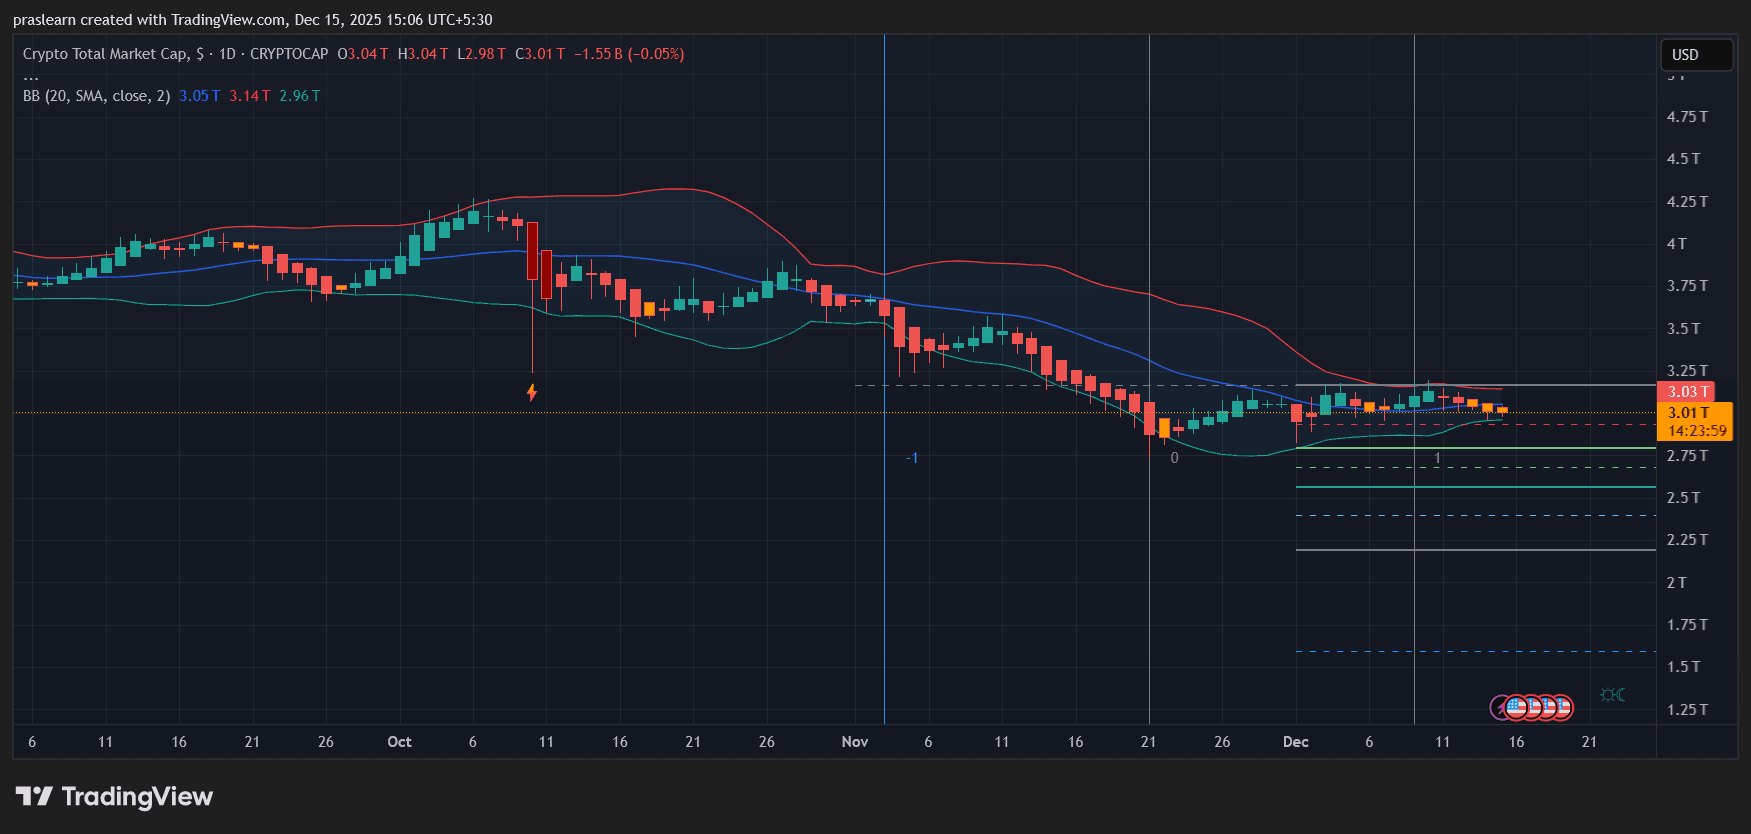
Looking at the daily TradingView chart of the total crypto market cap, the trend since early October has been decisively lower. The market topped near the upper Bollinger Band above $3.7 trillion and has since rolled over, respecting the mid-band as resistance on every bounce. That’s not what strength looks like.
Right now, total market cap is hovering around the $3.0–$3.05 trillion zone. This area has acted as short-term support, but it’s not a strong base. Price is compressing below the 20-day moving average, with Bollinger Bands narrowing, which often precedes a volatility expansion. Direction will be decided by macro, not technicals alone.
What stands out is the lack of follow-through on recent rebounds. Each bounce has been weaker than the last, suggesting buyers are cautious and liquidity is thin. That fits perfectly with a market waiting for the Fed.
Data Flood Week: Inflation, Jobs, and Consumer Health

This week’s packed economic calendar adds fuel to the fire. Employment data, retail sales, CPI, and consumer sentiment will all feed directly into rate expectations. For crypto, CPI on Thursday is the key release.
A softer CPI print would reinforce the idea that the Fed is done tightening and that liquidity conditions may improve into 2026. That’s the environment where crypto stabilizes and rotates, even if it doesn’t immediately trend higher.
A hotter CPI, however, undermines the entire bullish liquidity thesis. It would validate the current downtrend visible on the chart and increase the odds of a deeper correction. Crypto’s inflation hedge narrative will be tested here, and historically, it has not performed well when real yields rise.
What the Chart Is Really Saying About the Week Ahead
Technically, the total crypto market cap is in a wait-and-react phase. The range between roughly $3.0 trillion and $3.15 trillion defines the battlefield. A break above the range requires macro validation. A break below it likely accelerates selling as stops get triggered.
This is not a market that rewards aggressive positioning ahead of major events. Elevated open interest and thinning liquidity mean moves can be sharp in both directions, but follow-through will depend entirely on macro confirmation.
Crypto Market Outlook: Volatility First, Direction Second
This week is about survival before opportunity. A dovish Fed and benign CPI could stabilize the market and set up a constructive end to the year. A hawkish surprise or inflation shock, on the other hand, would align perfectly with the bearish structure already visible on the chart.
For now, crypto market remains reactive, not proactive. The chart is fragile, sentiment is cautious, and macro is in the driver’s seat. Expect volatility, respect the ranges, and remember that the real move often starts after the headlines fade.